
- S&P 500 moves slightly higher during the European session on Tuesday.
- US housing data will be released today, although this data is not expected to change market sentiment ahead of the Fed’s decision on Wednesday.
- The Fed is widely expected to leave rates unchanged on Wednesday, with the focus on the tone of Fed Chair Powell’s comments.
The index S&P 500 moves slightly higher during the European session on Tuesday, amid calm markets ahead of the United States (US) Federal Reserve’s (Fed) expected interest rate decision on Wednesday. At the time of writing, the S&P 500 remains within the previous day’s tight range and is trading at 4,459, up 0.15% on the day.
After falling nearly -1.20% the previous Friday, ending its second consecutive week in the negative, the S&P 500 remained in a tight range on Monday in the absence of major catalysts.
The Federal Reserve (Fed) meeting on Wednesday, September 20 is the focus of investors’ attention this week, although the market already expects interest rates to remain unchanged. CME Group’s FedWatch Tool Shows a 99% chance that the Fed will keep rates fixed at their current range of between 5.25% and 5.50%. The US consumer price index (CPI) last week recorded an increase in headline inflation in August, due to rising oil and gasoline prices, but annualized core inflation continued to fall. The August Producer Price Index (PPI) also showed a worrying rise in prices, but the market does not believe the data is strong enough to change central bankers’ minds.
S&P 500 Unlikely to Move on Another Rate Pause, But Stocks could trade up or down depending on how Fed Chairman Jerome Powell defines the economy, especially work. Any statement that central bank governors are contemplating further hikes is sure to send stock prices lower. At this time, markets are pricing the chances of a new rate hike at 40% by the end of the year.
Meanwhile, US housing starts and building permits data for August will be released during today’s American session, although this data alone should not be a market driver ahead of the Fed.
Frequently asked questions about the S&P 500
What is the S&P 500?
The S&P 500 is a widely followed stock index that measures the performance of 500 public companies and is considered a broad measure of the U.S. stock market. The influence of each company in the calculation of the index is weighted based on market capitalization. This is calculated by multiplying the number of listed shares of the company by the share price. The S&P 500 Index has achieved impressive returns: $1.00 invested in 1970 would have produced a return of almost $192.00 in 2022. The average annual return since its inception in 1957 has been 11.9%.
How are companies chosen to be included in the S&P 500?
Companies are selected by committee, unlike other indices where they are included based on established standards. Still, they must meet certain eligibility criteria, the most important of which is market capitalization, which must be equal to or greater than $12.7 billion. Other criteria are liquidity, domicile, market capitalization, sector, financial viability, listing time, and representation of the sectors of the United States economy. The nine largest companies in the index represent 27.8% of the index’s market capitalization.
How can I trade the S&P 500?
There are several ways to trade the S&P 500. Most retail brokers and spread betting platforms allow traders to use Contracts for Difference (CFDs) to place bets on price direction. In addition, you can buy index funds, mutual funds and exchange-traded funds (ETFs) that track the price of the S&P 500. The most liquid of the ETFs is the London Stock Exchange ETF. The most liquid of the ETFs is State Street Corporation’s SPY. The Chicago Mercantile Exchange (CME) offers futures contracts on the index and the Chicago Board of Options (CMOE) offers options, as well as ETFs, inverse ETFs, and leveraged ETFs.
What factors drive the S&P 500?
There are many factors that drive the S&P 500, but primarily it is the aggregate performance of its component companies, revealed in their quarterly and annual earnings reports. US and global macroeconomic data also contribute, influencing investor sentiment, which if positive, drives earnings. The level of interest rates, set by the Federal Reserve (Fed), also influences the S&P 500, as it affects the cost of credit, on which many companies largely depend. Therefore, inflation can be a determining factor, as well as other parameters that influence the decisions of the Federal Reserve.
S&P 500 technical analysis
At the time of writing, the S&P 500 is trading around 4,460 points. If the index moves higher, it could encounter initial resistance at 4,464 (high of the previous day), before the region of 4,480 and the round level of the 4,500 points.
On the other hand, initial support is found in 4,440 (previous day’s low), before falling to 4,430 (September 7 low) and at the round level of 4,400.
S&P 500 daily chart
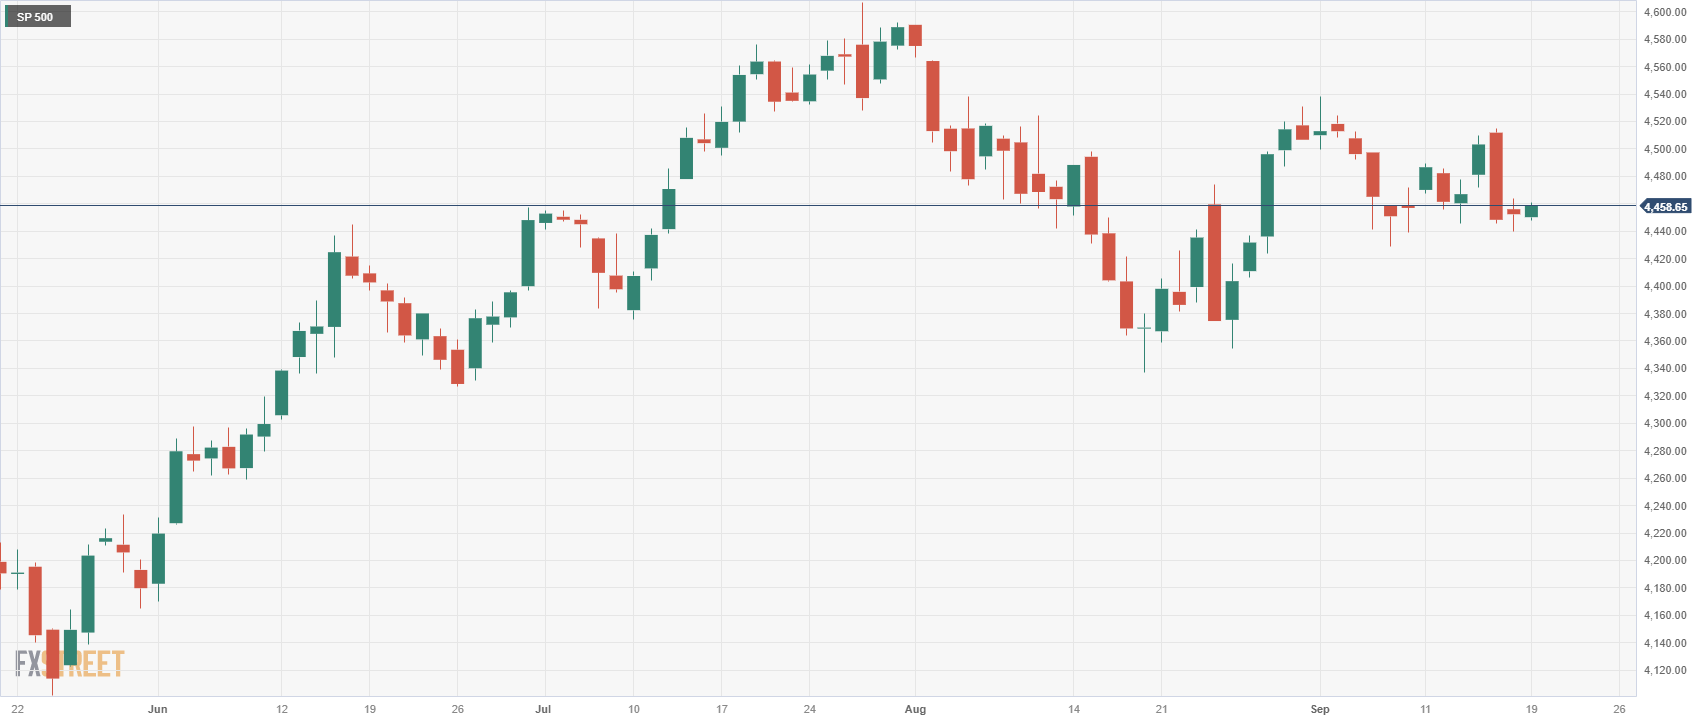
Source: Fx Street
I am Joshua Winder, a senior-level journalist and editor at World Stock Market. I specialize in covering news related to the stock market and economic trends. With more than 8 years of experience in this field, I have become an expert in financial reporting.


