- Tesla’s 444,000 deliveries beat the consensus of 439,000 for the second quarter.
- TSLA stock’s performance (+16.9%) marks its best week since mid-January.
- The launch of RoboTaxi on August 8 remains in focus for merchants.
- Tesla shares have risen above the 200-week SMA.
So far, this has been the best week for the Tesla (TSLA) shareholders since the third week of January, and it’s only Tuesday. Tesla shares have gained 16.9% so far this week, rising more than 10% on Tuesday alone.
The reason for the rally was Tesla’s second-quarter delivery figures, which were released earlier than expected on Tuesday.
Tesla Stock News: Upside Surprises in Q2
Tesla reported nearly 444,000 global deliveries in the second quarter on Tuesday. Analysts had expected 439,300. Additionally, 410,831 vehicles were produced during the quarter.
The more affordable Model 3 and Model Y accounted for 422,405 of total deliveries in the quarter, while its luxury models sold more than 21,500 units.
While the figures continue to show that demand for Teslas has plateaued over the past 18 months, the data was much better than the mood leading up to its release. Barclays had cited registration data on Monday to cut its delivery forecast to 415,000. So when the announcement came earlier than expected, it unleashed a wave of pent-up optimism in the market.
The figure was still below the previous year’s deliveries of 466,000. Tesla’s best quarter in history was the fourth quarter of 2023, when it delivered more than 484,000.
The stock’s momentum was driven by a general surge ahead of Tesla’s August 8 announcement of its RoboTaxi efforts. Elon Musk and company have pinned their hopes on diversifying from the core car business into an autonomous competitor to UBER and Cruise.
Tesla Stock Forecast
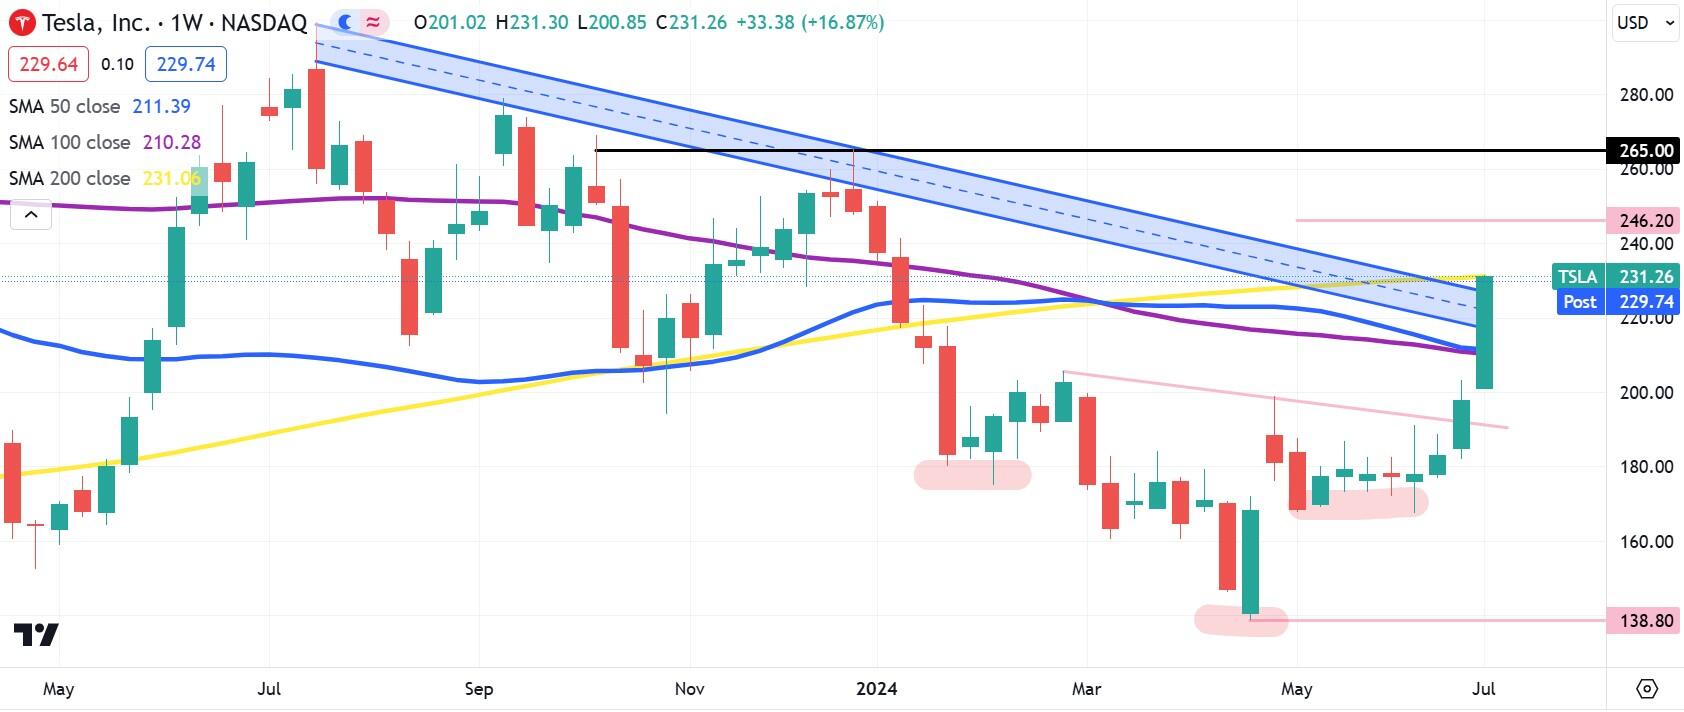
Tesla stock has broken above the descending trend line on the weekly chart. This pattern started in the summer of 2023, so it is quite significant. Obviously, this leads us to believe that the rally will continue.
TSLA stock is trading above its 200-week simple moving average (SMA) for the first time since January as well. From here, the projected price target of the Inverted Head and Shoulders pattern (seen in pink) is $246.20. Above there lies historical resistance near $265.
TSLA Stock Weekly Chart
Source: Fx Street
I am Joshua Winder, a senior-level journalist and editor at World Stock Market. I specialize in covering news related to the stock market and economic trends. With more than 8 years of experience in this field, I have become an expert in financial reporting.


