
Short-term bitcoin-investors formed a rare signal, which in the past already pointed to the local bottom of the market. This was announced by Vibes Capital Management analyst Frank Fetter.
Officially Got the Oversold Print on the Short-Term Holder MVRV Bollinger Bands. Last Three Instances of this:
1. Yen Carry Unwind – $ 49k
2. Tariff Tantrum – $ 74k
3. Today – $ 108k $ BTC pic.twitter.com/aqcyxlwbzw– Frank (@frankafetter) September 1, 2025
The purchase rate of coins belonging to the short -term holders was equal to the current market price of the first cryptocurrency. This level is often supported in corrections during the bull market, but its loss can lead to a long decrease.
The MVRV indicator for the mentioned category of holders reached a break -in. Its deviation from the lower band of the Bollinger is extremely rare. Over the past year, this happened only twice:
- In August 2024, against the backdrop of Carrie Trade with Japanese Yena;
- In April 2025, when digital gold fell below $ 75,000 due to US trade duties.
Currently, the BTC/USD graph is formed by bull divergence on the four -hour RSI indicator. According to Fetter, this indicates the impending turning of the trend.
The “fragile” market
On September 2, the price of bitcoin briefly recovered by $ 110,000 after falling to $ 107,000 at the end of August. However, Glassnode analysts recorded a decrease in the interest of investors. According to them, the structure of the market remains unstable.
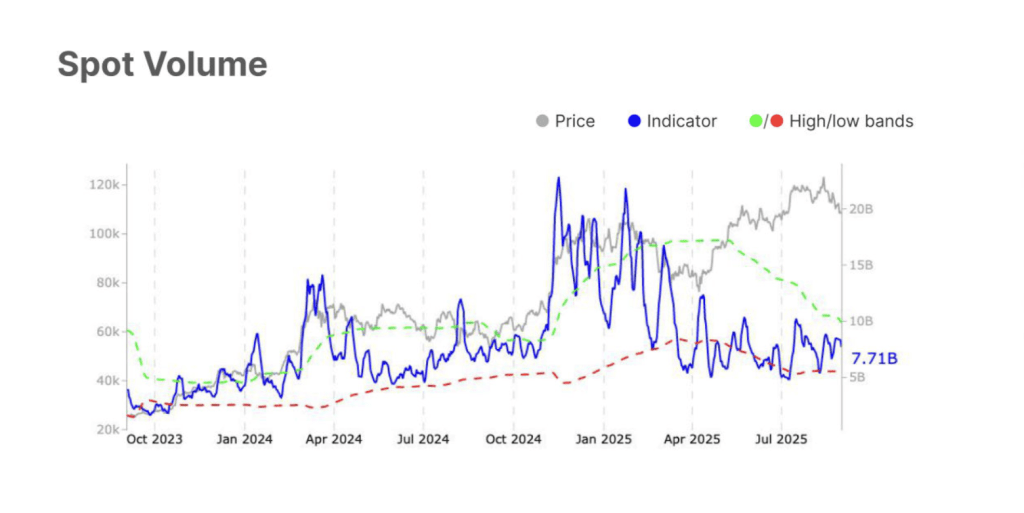
Last week, the demand in the spoting market of digital gold was weak. The volume of bidding fell by 9% – from $ 8.5 billion to $ 7.7 billion. Experts emphasized that investors and traders lose confidence in the restoration of bitcoin.
The CVD indicator has grown a little, meaning a decrease in sales. Nevertheless, “spawning metrics indicate fragile demand”, added to Glassnode.
The situation in the futures market also indicates the caution of the players. Open interest decreased from $ 45.8 billion to $ 45 billion, and the amount of financing fell from $ 3.8 billion to $ 2.8 billion.
What levels to follow?
The key resistance was $ 110 500 – the upper boundary of the descending channel. Closing the day above can open the way to the liquidity zone of $ 110,000-117,000.
Experts called $ 108,000 and $ 107,300 in the nearest support levels.
The founder of MN Capital Michael Van de Poppe believes that in order to update the historical maximum, Bitcoin needs to gain a foothold above $ 112,000. Otherwise, the cryptocurrency will have a rollback of $ 103,000.
The Area Remains The Same For $ BTC.
IF Wearly Break $ 112k, We’ll Be Onto a New Ath.
Otherwise, i’d BE Looking at $ 103kish for a Great Opportunity.
Interstingly Enown, Gold Is Yet to Make A New Ath.
When Bitcoin? pic.twitter.com/jdruy5ba8o
– Michaël van de Poppe (@cryptomichnl) September 2, 2025
The liquidity map shows significant accumulations of orders for the purchase in the range of $ 105 500-107 000 and for sale-in the zone $ 110 000-111,000. ALPHABTC analyst suggested that the market “hunts for money” and first could test the shorts with shorts before returning to the verification of minimums.
📈 #Bitcoin Liquidity Hunt 🎯
Looks Like They Are Coming for that Big Cluster of Shorts 110k-111k, The Likely Back to Run The Monday Low and the Longs from the Weekend.#Crypto #Btc pic.twitter.com/crrwauoyq
– Alphabtc (@mark_cullen) September 2, 2025
In early September, CEO Bitcoin Magazine accused two whales of Bitcoin’s “braking”.
Be in the know! Subscribe to Telegram.
Source: Cryptocurrency
I am an experienced journalist and writer with a career in the news industry. My focus is on covering Top News stories for World Stock Market, where I provide comprehensive analysis and commentary on markets around the world. I have expertise in writing both long-form articles and shorter pieces that deliver timely, relevant updates to readers.


