
- The Australian dollar is recovering land after the publication of key economic data from both Australia and China.
- The Australian consumer price index rose 0.9% intertrmetral in the first quarter, compared to a previous increase of 0.2% and an expected increase of 0.8%.
- The manufacturing PMI of the China NBS fell to 49.0 in April from 50.5 in March, returning to the contraction in the sector.
The Australian dollar (AUD) is gaining ground on Wednesday after a fall of more than 0.50% against the US dollar (USD) in the previous session. The Aud/USD torque can be seen after the publication of key economic data from Australia and China.
The Australian Statistics Office (ABS) reported that the Consumer Price Index (CPI) rose 0.9% intertrimestral in the first quarter of 2025, compared to an increase of 0.2% in the fourth quarter of 2024 and exceeding market expectations of an increase of 0.8%. In annual terms, the CPI rose 2.4% in the first quarter, exceeding the 2.2% forecast.
Australia’s monthly CPC remained stable with an increase of 2.4% year -on -year in March. Meanwhile, the middle IPC trimmed from the Bank of the Australian Reserve (RBA) rose 2.9% year -on -year in the first quarter, in line with expectations, while the quarterly figure also complied with the forecasts by 0.7%.
In China, the National Statistics Office (NBS) reported that the manufacturing purchasing managers (PMI) index fell to 49.0 in April from 50.5 in March, being below the consensus of 49.9 and indicating a return to contraction. The non -manufacturing PMI was also weakened, going down to 50.4 in April from 50.8 in March, below the expected 50.7.
The Aud faced winds against the continuous global commercial uncertainties that continue to affect the feeling of investors. Meanwhile, inflationary pressures in Australia in early 2025 have weakened the expectations of greater monetary relief by the Bank of the Australian Reserve (RBA). Markets widely anticipate a 25 basic points rate cut in May, since policy responsible are prepared for possible economic repercussions of recently introduced US tariffs.
The Australian dollar regains land as confidence in US assets weakens
- The American dollar index (DXY), which measures the USD compared to six main currencies, maintains its position above 99.00 at the time of writing. The attention now focuses on the US Personal Consumer Expenses Index (PCE) for March, which will be published later on Wednesday.
- On Tuesday, the US Labor Statistics Office reported that employment vacancies and the labor rotation survey (Jolts) fell to 7.19 million in March, compared to a revised 7.48 million in February and below the market forecast of 7.5 million. This is the lowest level since September 2024, reflecting a weakened labor demand amid the growing economic uncertainty in the United States (USA).
- The president of the USA, Donald Trump, indicated his opening to reduce Chinese tariffs, while Beijing exempt certain American products from his taxes of 125%. This movement has fed hope that the prolonged commercial war between the two largest economies in the world could be coming to an end.
- President Trump said there have been advances and that he has spoken with Chinese President Xi Jinping. However, a spokesman for the Chinese embassy firmly denied any current negotiation with the US, stating: “China and the US are not having any consultation or negotiation on tariffs.” The spokesman urged Washington to “stop creating confusion.”
- According to the Wall Street Journal, President Trump intends to reduce the impact of his automotive tariffs ensuring that the rights on cars manufactured abroad do not accumulate with other tariffs and reduce the levies on the foreign parts used in cars production.
- The US Treasury Secretary, Scott Besent, said Monday that he interacted with the Chinese authorities last week, but did not mention tariffs. Besent said that, although the US government is in communication with China, it is up to Beijing to take the first step to relieve the tariff dispute, given the commercial disadvantage between the two countries.
- China’s Foreign Minister Wang Yi said on Tuesday to make concessions and retreat would only encourage the bully, emphasizing that dialogue is key to solving differences.
- China’s Ministry of Finance declared on Friday that global economic growth is still slow, with tariffs and commercial wars that continue to undermine economic and financial stability. The Ministry urged all parties to improve the international economic and financial system through a stronger multilateral cooperation, according to Reuters.
The Australian dollar moves below 0.6400; Try the nine -day EMA
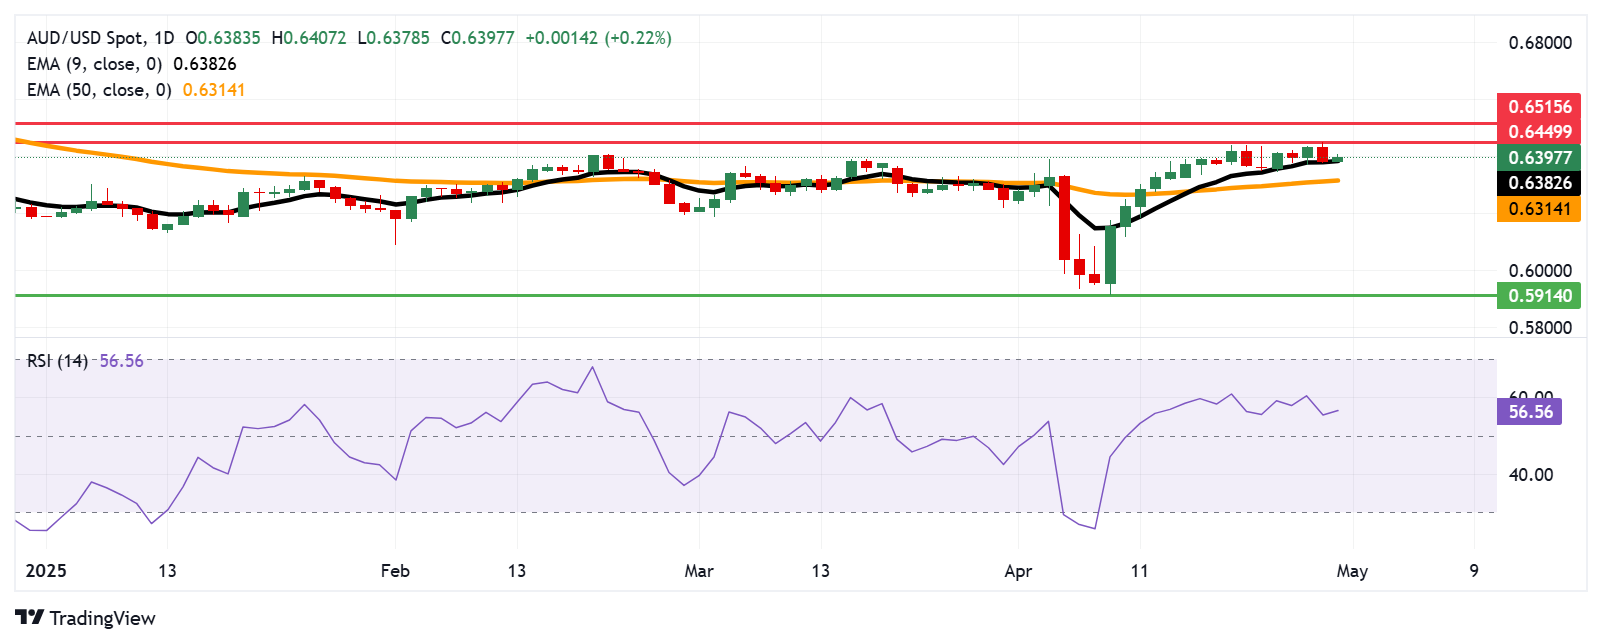
The aud/USD is around 0.6390 on Wednesday, with the daily graphic reflecting an upward perspective. The pair continues to negotiate over the nine -day exponential (EMA) mobile average, while the 14 -day relative force index (RSI) remains well above level 50, which suggests a sustained bullish impulse.
On the positive side, the immediate resistance is observed in the recent maximum of four months of 0.6449, reached on April 29. A decisive rupture above this level could pave the way for a movement towards a maximum of five months at 0.6515.
The nine -day EMA at 0.6382 appears as the immediate support, followed by the 50 -day EMA in 0.6314. A rupture below these support levels would weaken the bullish structure and could expose the torque to deeper losses, potentially pointing to the minimum of March 2020 around 0.5914.
AUD/USD: Daily graphic
Australian dollar Price today
The lower table shows the percentage of change of the Australian dollar (AUD) compared to the main currencies today. Australian dollar was the strongest currency in front of the euro.
| USD | EUR | GBP | JPY | CAD | Aud | NZD | CHF | |
|---|---|---|---|---|---|---|---|---|
| USD | 0.24% | 0.12% | 0.07% | 0.06% | -0.22% | 0.01% | 0.03% | |
| EUR | -0.24% | -0.11% | -0.16% | -0.18% | -0.46% | -0.22% | -0.20% | |
| GBP | -0.12% | 0.11% | -0.08% | -0.07% | -0.35% | -0.11% | -0.10% | |
| JPY | -0.07% | 0.16% | 0.08% | -0.02% | -0.29% | 0.00% | -0.02% | |
| CAD | -0.06% | 0.18% | 0.07% | 0.02% | -0.28% | -0.04% | -0.02% | |
| Aud | 0.22% | 0.46% | 0.35% | 0.29% | 0.28% | 0.24% | 0.26% | |
| NZD | -0.01% | 0.22% | 0.11% | -0.00% | 0.04% | -0.24% | 0.02% | |
| CHF | -0.03% | 0.20% | 0.10% | 0.02% | 0.02% | -0.26% | -0.02% |
The heat map shows the percentage changes of the main currencies. The base currency is selected from the left column, while the contribution currency is selected in the upper row. For example, if you choose the Australian dollar of the left column and move along the horizontal line to the US dollar, the percentage change shown in the box will represent the Aud (base)/USD (quotation).
Economic indicator
Consumer Price Index (MOM)
The consumer price index published by the Bank of the Australian Reserve (RBA) and reissued by the Australian Statistics Office It is a measure of the evolution of prices by comparing retail prices of a basket of representative purchase of goods and services. The purchasing power of the AU is dragged by inflation. The CPI is a key indicator to measure inflation and changes in purchase trends. A high reading is considered positive (or bullish) for the AUD, while a low reading is considered negative (or bassist).
Read more.
Last publication:
LIE ABR 30, 2025 01:30
Frequency:
Monthly
Current:
2.4%
Dear:
–
Previous:
2.4%
Fountain:
Australian Bureau of Statistics
Source: Fx Street
I am Joshua Winder, a senior-level journalist and editor at World Stock Market. I specialize in covering news related to the stock market and economic trends. With more than 8 years of experience in this field, I have become an expert in financial reporting.


