
- The Australian dollar maintains its position since retail sales increased by 1.2% intermensual in June, compared to the expected increase of 0.4%.
- The purchasing managers index (PMI) of China’s NBS fell to 49.3, while the non -manufacturing PMI was reduced to 50.1 in July.
- The Fed maintained its reference interest rate in a range of 4.25% -4.5% in July.
The Australian dollar (AUD) can be seen on Thursday, stopping its loss streak of five days. The Aud/USD torque maintains its position after the publication of key economic data from Australia and its close commercial partner, China.
Australian retail sales increased 1.2% intermensual in June, compared to 0.5% in May (reviewed from 0.2%). Reading exceeded market expectations of 0.4%. Retail sales grew by 0.3% intertrimestral in the second quarter, compared to 0.1% in the first quarter (reviewed from 0%).
The purchasing managers index (PMI) Manufacturer of the NBS of China fell to 49.3 in July, compared to 49.7 reported in June. The market forecast was 49.7. The NBS non -manufacturing PMI was reduced to 50.1 in July, compared to June 50.5 and below the estimated figure of 50.3.
The Australian dollar advances while the US dollar stops its winning streak
- The dollar index (DXY), which measures the value of the US dollar compared to six main currencies, is stopping its winning streak and quoting around 99.80 at the time of writing. However, the dollar gained ground after the Federal Reserve (FED) decided to maintain its federal funds rate in a range of 4.25% -4.5% at its July meeting on Wednesday, as expected widely.
- The president of the FED, Jerome Powell, said at a conference after the policy that the US Central Bank “has not made decisions” about a possible policy change in September, and can take time to evaluate the effect of tariffs on consumer prices.
- The Gross Domestic Product (GDP) of the US expanded at an annual 3.0% rate for the period from April to June. This figure followed the contraction of 0.5% in the first quarter and was stronger than the expectation of 2.4%.
- The United States and the European Union reached a Marco Commercial Agreement on Sunday that establishes 15% tariffs on most European goods, which will enter into force on August 1. This agreement has ended a stagnation of months, according to Bloomberg.
- The US Treasury Secretary, Scott Besent, said the US and China will continue the conversations to hold a tariff truce before the deadline in two weeks, and Trump will make the final decision on any extension. Besent minimized any expectation that Trump rejected the extension. It is important to note that any change in the Chinese economy could impact the AU, since China and Australia are nearby commercial partners.
- China’s Minister of Finance, Lan Fo’an, said Tuesday that the country will increase tax support to boost domestic consumption and mitigate the growing winds against economic. He emphasized that the uncertainty about China’s development environment is growing and Beijing will adopt more proactive fiscal policies to help stabilize growth.
- Australia’s consumer price (CPI (CPI) increased 0.7% intertrmetral in the second quarter, compared to the 0.9% increase in the first quarter and the expected growth of 0.8%. Annually, IPC inflation was reduced to 2.1% in the second quarter, compared to the previous 2.4% and below the market consensus of 2.2%.
- The monthly consumer price index increased by 1.9% year -on -year in June, compared to the previous reading of an increase of 2.1%. The middle IPC trimmed from the RBA for the second quarter increased 0.6% and 2.7% in quarterly and annual terms, respectively. The markets estimated an increase of intentrrimestral 0.7% and 2.7% year -on -year in the quarter until June.
The Australian dollar remains close to 0.6450 after bouncing from monthly minimums
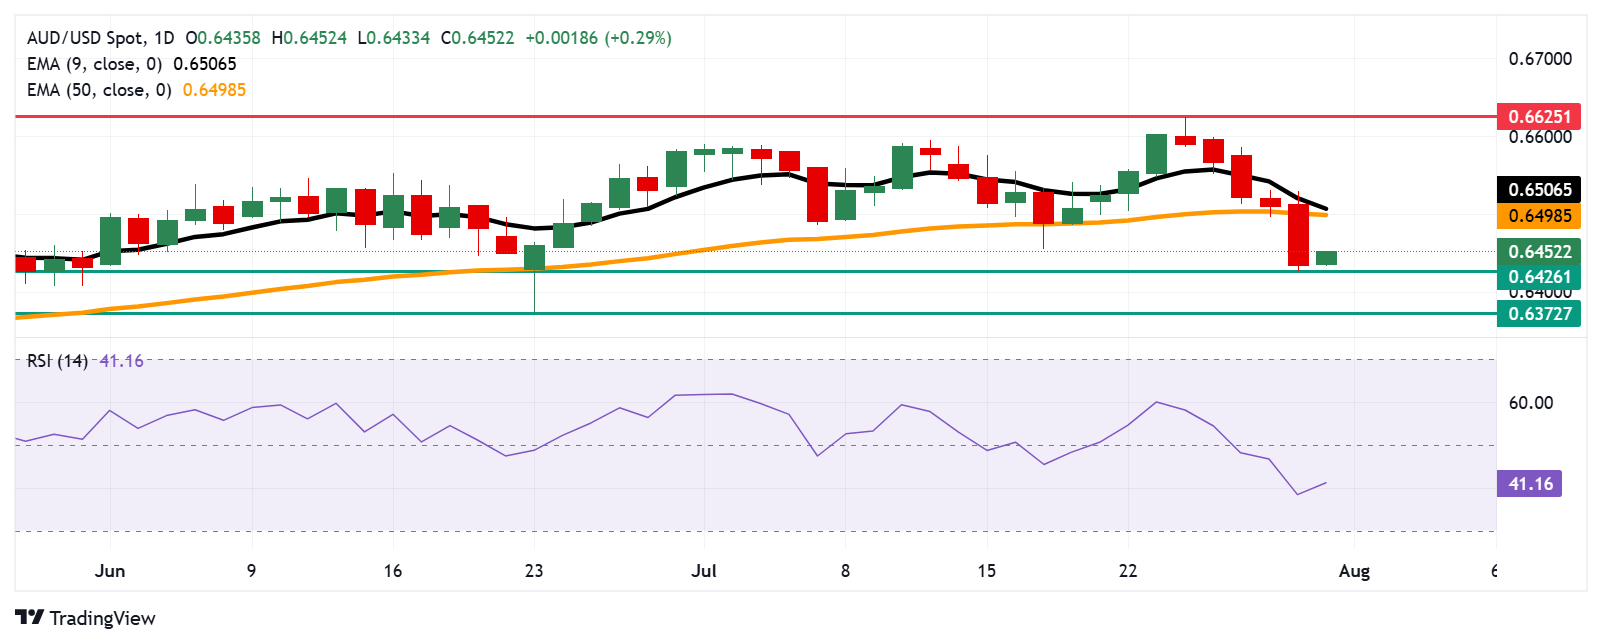
The AUD/USD is quoted around 0.6450 on Thursday. The technical analysis of the daily chart indicates a bassist bias since the 14 -day relative force (RSI) index has fallen below the 50’s mark. In addition, the torque is maintained below the nine -day exponential mobile average (EMA), indicating that the short price impulse in the short term is weaker.
Down, the Aud/USD torque could find the main support in the monthly minimum of 0.6426, which was recorded on July 30. A rupture below this level could exert down pressure on the torque to test a minimum of two months at 0.6372, registered on June 23.
The Aud/USD torque can aim at the initial barrier in the 50 -day EMA of 0.6498, followed by the nine -day EMA of 0.6506. A rupture above these levels could strengthen the impulse of the price in the short and medium term and support the torque to explore the region around eight months at 0.6625.
AUD/USD: Daily graphic
Australian dollar Price today
The lower table shows the percentage of change of the Australian dollar (AUD) compared to the main currencies today. Australian dollar was the strongest currency against the US dollar.
| USD | EUR | GBP | JPY | CAD | Aud | NZD | CHF | |
|---|---|---|---|---|---|---|---|---|
| USD | -0.21% | -0.14% | -0.36% | 0.00% | -0.24% | -0.22% | -0.18% | |
| EUR | 0.21% | 0.05% | -0.15% | 0.21% | -0.05% | -0.00% | 0.04% | |
| GBP | 0.14% | -0.05% | -0.20% | 0.16% | -0.11% | -0.06% | -0.01% | |
| JPY | 0.36% | 0.15% | 0.20% | 0.37% | 0.13% | 0.20% | 0.22% | |
| CAD | -0.00% | -0.21% | -0.16% | -0.37% | -0.17% | -0.23% | -0.17% | |
| Aud | 0.24% | 0.05% | 0.11% | -0.13% | 0.17% | 0.05% | 0.12% | |
| NZD | 0.22% | 0.00% | 0.06% | -0.20% | 0.23% | -0.05% | 0.05% | |
| CHF | 0.18% | -0.04% | 0.00% | -0.22% | 0.17% | -0.12% | -0.05% |
The heat map shows the percentage changes of the main currencies. The base currency is selected from the left column, while the contribution currency is selected in the upper row. For example, if you choose the Australian dollar of the left column and move along the horizontal line to the US dollar, the percentage change shown in the box will represent the Aud (base)/USD (quotation).
Economic indicator
Retail sales (MOM)
This survey of goods sold by retail merchants publishing the Australian Bureau of Statistics It is based on a sample of retail stores of different types and is considered an indicator of the economy growth rate. It shows the performance of the retail sector in the short and medium term. A result superior to the market consensus is bullish for the Australian dollar, while a lower result is bassist.
Read more.
Last publication:
Jul 31, 2025 01:30
Frequency:
Monthly
Current:
1.2%
Dear:
0.4%
Previous:
0.2%
Fountain:
Australian Bureau of Statistics
The main indicator of consumers of Australia, retail sales, is published by the Australian Statistics Office (ABS) about 35 days after the end of the month. It represents approximately 80% of the total retail turnover in the country and, therefore, has a significant influence on inflation and GDP. This advanced indicator has a direct correlation with inflation and growth prospects, which influences the decision on interest rates and the assessment of the Aud of the Bank of the Reserve of Australia (RBA). The statistics office uses the advanced factor method, which guarantees that seasonal factors are not distorted by the impacts of COVID-19.
Source: Fx Street
I am Joshua Winder, a senior-level journalist and editor at World Stock Market. I specialize in covering news related to the stock market and economic trends. With more than 8 years of experience in this field, I have become an expert in financial reporting.


