- GBP / USD gained traction for the second day in a row and rebounded further from its two-and-a-half-month lows.
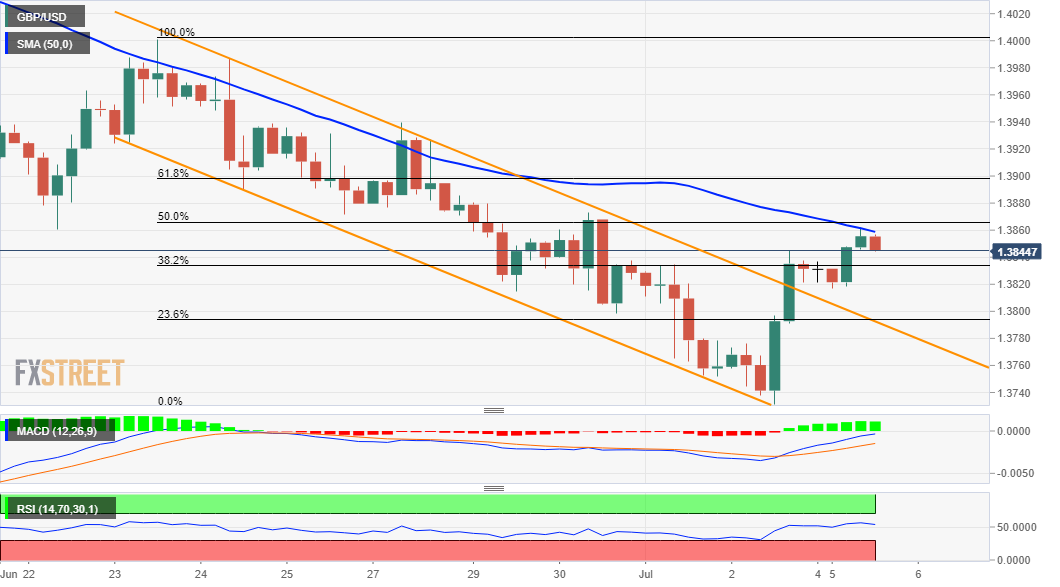
- Momentum confirmed a short-term bullish breakout through a week-and-a-half descending channel.
- Mixed technical indicators on hourly / daily charts warrant some caution before placing aggressive bull bets.
The pair GBP/USD It built on the positive post-NFP recovery move from 2-1 / 2-month lows and gained some traction for the second straight session on Monday. The momentum sent the pair to three-day highs around 1.3850 during the middle of the European session.
Investors lowered their expectations of an earlier-than-expected Fed policy tightening following an unexpected rise in the US unemployment rate This, in turn, kept the US dollar bulls on the defensive. and it was seen as a key factor that pushed the GBP / USD higher.
On the other hand, expectations that British Prime Minister Boris Johnson is preparing to lift most of the restrictions in England on July 19 acted as a tailwind for the British pound. This provided additional momentum to the GBP / USD pair and continued to support the ongoing upward movement.
From a technical perspective, GBP / USD confirmed a bullish breakout through resistance marked by the upper end of a week-and-a-half downtrend channel. The bulls now await a sustained move beyond the 1.3850 confluence region before positioning for further gains.
The mentioned region comprises the 50% Fibonacci level of the 1.4000-1.3732 dip and the 50-period SMA on the 4-hour chart. This should now act as a key point for traders and help determine the short-term trajectory of the GBP / USD pair amid the absence of fundamental triggers.
Meanwhile, technical indicators on the hourly charts have been gaining positive traction, but have yet to rebound from bearish territory. Therefore, a sustained move beyond the 1.3850 region is needed to confirm that the GBP / USD pair could have bottomed out near the 1.3730 zone.
The next relevant resistance is pegged near the 23.6% Fibonacci level, around 1.3900. This is followed by the 1.3925-30 supply zone, above which the GBP / USD appears ready to take advantage of momentum and head back to regain the key psychological level of 1.4000.
On the other hand, the 38.2% Fibonacci level, around the 1.3835 region, now appears to protect the immediate drop before the daily lows, around the 1.3815 area. Any subsequent decline could be seen as a buying opportunity and remain limited near the break point of trend channel resistance.
A convincing break below the latter, currently around the 1.3800-1.3795 region, will nullify the prospects for further gains and make the GBP / USD vulnerable. The next relevant support is pegged near the 1.3730 region, or the monthly lows that were touched on Friday prior to 1.3700.
4 hour chart

Technical levels
.
Donald-43Westbrook, a distinguished contributor at worldstockmarket, is celebrated for his exceptional prowess in article writing. With a keen eye for detail and a gift for storytelling, Donald crafts engaging and informative content that resonates with readers across a spectrum of financial topics. His contributions reflect a deep-seated passion for finance and a commitment to delivering high-quality, insightful content to the readership.


