Bitcoin
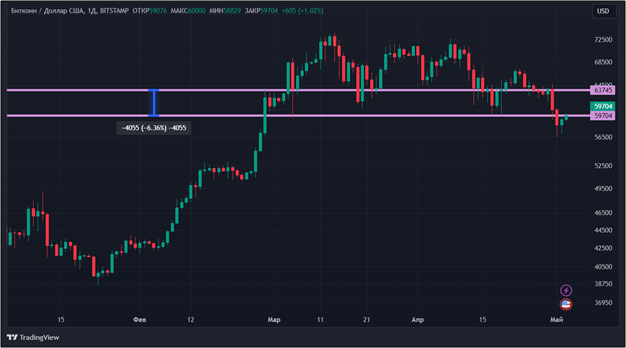
Bitcoin lost a little more than 6% over the past week from April 26 to May 3. At the low on May 1, the price reached $56,500, which has not happened since February 27. In fact, the entire decline occurred in two trading sessions, on Tuesday and Wednesday. Then Bitcoin lost almost 9% of its value.
Source: tradingview.com
The main reasons for the negativity were the persecution of prominent figures in the crypto industry. On April 30, the verdict was announced in the United States for the former CEO of the Binance exchange, Changpeng Zhao. And although it turned out to be much milder than planned (three years of imprisonment was replaced by four months), this news clearly did not cause positive feelings among investors.
A little later, it became known about the arrest in Spain of the famous crypto enthusiast Roger Ver. He faces extradition to the United States. The official reason for the law enforcement claims is the forgery of tax returns and non-payment of taxes in the amount of about $48 million. Naturally, among crypto enthusiasts these arguments were considered far-fetched.
But on Wednesday, Bitcoin began to grow. The reason, apparently, was the speech of Fed Chairman Jerome Powell regarding the key rate. The official did not reveal anything unexpected. As expected, the rate remained unchanged in the range of 5.25%-5.5%. Powell's other statement is moderately positive: that further increases look unlikely. Most likely, this is why Bitcoin began to grow, although
slightly.
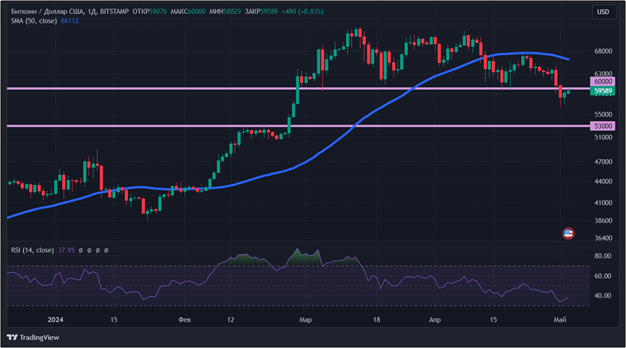
From the point of view of technical analysis, Bitcoin continues its downward trend. On May 1, the cryptocurrency reached two-month lows. Indicators indicate a correction: price is below the 50-day moving average (indicated in blue), RSI is below 50. If the trend continues, a decline to the support level around $53,000 is quite possible. We can talk about a change in trend only after consolidating above the resistance level – $60,000.
Source: tradingview.com
Fear and Greed Index compared to last week dropped by 22 points. Now its value is 48. This speaks of balance, a fragile neutrality between fear and greed.
Ethereum
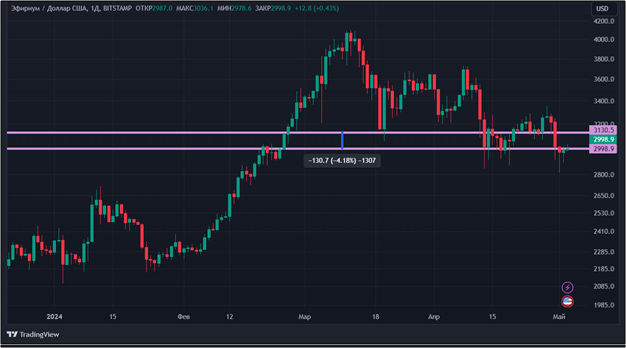
The price of ether fell by a little more than 4% from April 26 to May 3. The dynamics of the week were determined by three trading sessions in the middle: from Monday to Wednesday. But the beginning and end of the time period were in the black, albeit small.
Source: tradingview.com
The reasons for the decline in ether are the same as for Bitcoin. True, there are a couple of exclusively negative aspects. While there are no specifics in the United States regarding spot ETFs for ether, trading in similar instruments has started in Hong Kong. The results were quite disastrous. On the first day, trading volume was only $12 million, compared to the $4.6 billion that the creators of Bitcoin exchange-traded funds managed to get when launching spot BTC-ETFs in the United States. Asian results are nothing but
failure cannot be named.
Also in recent days, the number of liquidations of long positions has increased significantly. From April 29 to May 3, the volume accumulated by more than $201 million. For comparison, during the same period, shorts were liquidated in the amount of $67 million, which is exactly three times less.

Source: coinglass.com
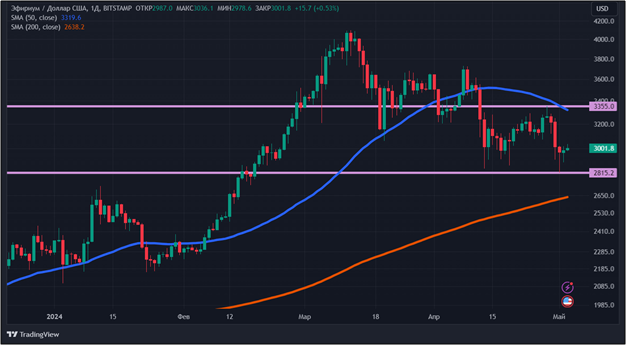
From a technical analysis point of view, Ethereum, like Bitcoin, is in bearish territory. This is evidenced by the price being below the 50-day moving average (indicated in blue). However, in the long term the trend is still upward. This is indicated by the price being above the 200-day moving average (indicated in orange). The nearest support and resistance levels: $2,815.2 and $3,355, respectively.
Source: tradingview.com
Solana
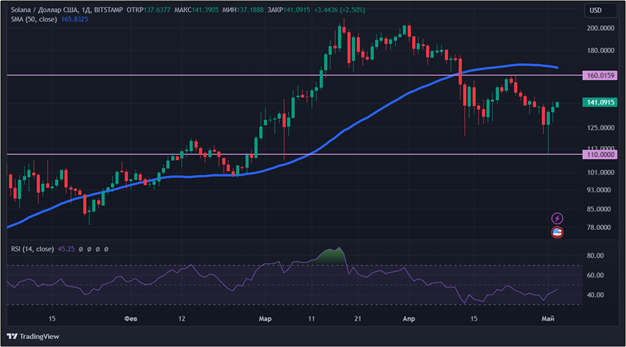
The week from April 26 to May 3 turned out to be relatively quiet for Solana. The SOL token rose in price by only 0.94%. It is worth noting: such dynamics have developed solely due to the last three trading sessions: from the lows ($110), Solana grew by more than 27.5%.

Source: tradingview.com
Franklin Templeton, which launched a Bitcoin spot ETF in early 2024, expressed support for Solana. Company specialists expect accelerated general approval of this cryptocurrency. At Franklin Templeton
believe, that after understanding the problems that arose with the Solana blockchain in March 2024, the growth of the coin should continue. This rhetoric was one of the reasons for the price change in the second half of the week.
CEO of Artist Platform
Drip House Vibhu Norby said that the number of daily network users has remained stable around 100,000. At its peak, the figure reached 160,000. However,
notes Norby, the quality of most of them left much to be desired.
But the Lookonchain platform recorded an example: how to skillfully use Solana. One of the traders on April 29, within 15 minutes, was able to turn 500 SOL worth $67,000 into 5,789 SOL worth $781,000. To do this, he only
needed buy and sell the QUACK token, trading for which began for the first time on the same day.
From the point of view of technical analysis, a correction has been observed since March 18. Indicators also provide confirmation: the cryptocurrency is trading below the 50-day moving average (marked in blue), RSI is below 50. In order for the trend to change, Solana must overcome the resistance level around $160. The support level is the low of the past week: $110.
Source: tradingview.com
Conclusion
So, the week passed for the main cryptocurrencies under the sign of decline, the indicators turned red more often than green. The main reasons were complaints from law enforcement against prominent crypto enthusiasts, as well as a lack of positivity from American regulatory agencies.
This material and the information contained herein do not constitute individual or other investment advice. The opinion of the editors may not coincide with the opinions of the author, analytical portals and experts.
Source: Bits
I am an experienced journalist, writer, and editor with a passion for finance and business news. I have been working in the journalism field for over 6 years, covering a variety of topics from finance to technology. As an author at World Stock Market, I specialize in finance business-related topics.


