- The Dow Jones retreated another 0.9% at Thursday’s low.
- Mixed earnings reports have tipped key stocks lower.
- The Dow is headed for its first week of losses since August.
The Dow Jones Industrial Average (DJIA) declined further toward the lower end on Thursday, falling nearly 400 points to the bottom, as uneven earnings numbers dragged down key stocks further. The main stock index has moderated to a more reasonable -150 points on the day, facing a 0.4% contraction from Thursday’s opening bids.
The US Purchasing Managers’ Index (PMI) numbers were generally higher than expected, helping to strengthen stocks overall despite sharp declines in key Dow-listed stocks. US Manufacturing PMI activity figures rose to 47.8 in October, beating the expected 47.5 and rising further from 47.3 in August. Meanwhile, the services component of the PMI rebounded to 55.3, rising from 55.2 the previous month and beating the expected drop to 55.0.
Dow Jones News
Despite the overall upbeat figure in key US activity figures, the Dow Jones is being dragged into the red by losses in key weighted players. About two-thirds of the index is testing in the red on Thursday, but most of the losses are contained within key players in the technology space as the chipmaker rally continues to falter.
IBM (IBM) dropped the ball, falling more than 6.5% and sliding below $218 per share after missing revenue forecasts in the third quarter. Honeywell (HON) also lost weight, falling 5% and falling from $210 per share after revenue, which grew during the period, missed Wall Street expectations, leading the company to lower guidance end of the year.
Dow Jones Price Forecast
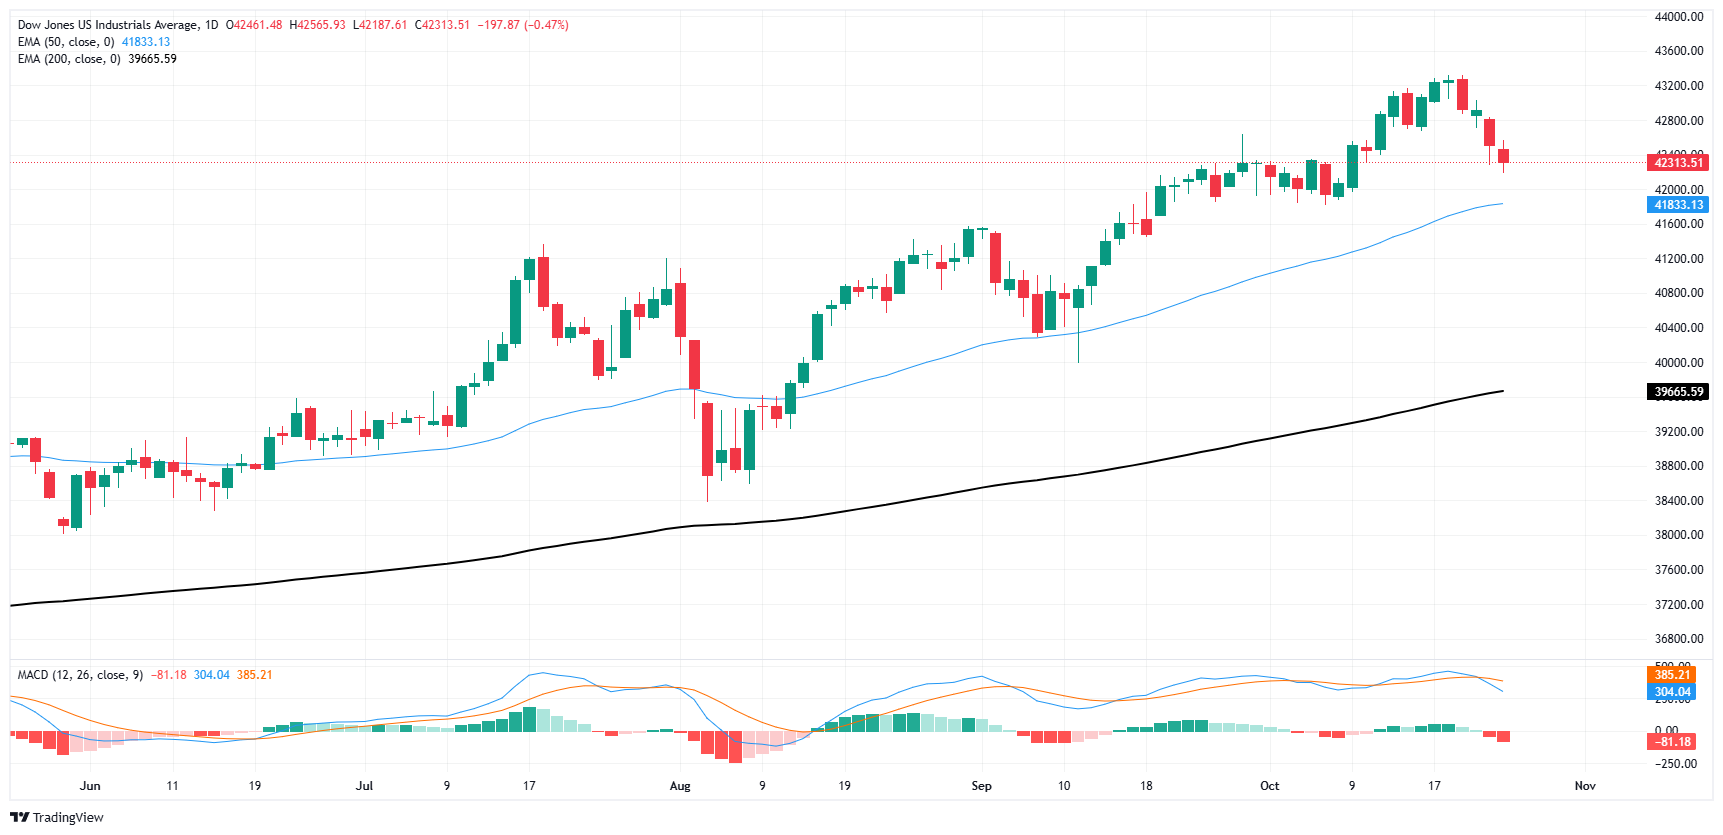
The daily chart of the Dow Jones Industrial Average (DJIA) reflects a bearish pullback after reaching a peak near 43,600. The index has fallen to 42,331.67, showing a series of bearish candles as it approaches the 50-day EMA, currently at 41,833.84. The 50 day EMA has provided support in the past, and it will be critical to monitor whether this level holds once again. If it does, a possible bounce could see the price testing the recent highs around 43,600. On the other hand, if the 50-day EMA is broken, a more significant correction could be in play, with the next support target around the 200-day EMA at 39,665.77.
The MACD indicator is signaling an increase in bearish momentum. The MACD line has crossed below the signal line, and the histogram is deepening into negative territory. This confirms the weakening of bullish sentiment and could suggest further decline in the short term. Traders should be cautious of further bearish price action, especially if the DJIA fails to hold the 50-day EMA. A break below could accelerate selling pressure, with a deeper pullback towards the 200-day EMA in focus.
Dow Jones Daily Chart
The Dow Jones FAQs
The Dow Jones Industrial Average, one of the world’s oldest stock indices, is made up of the 30 most traded securities in the United States. The index is weighted by price rather than capitalization. It is calculated by adding the prices of the securities that comprise it and dividing them by a factor, currently 0.152. The index was founded by Charles Dow, also founder of the Wall Street Journal. In recent years it has been criticized for not being sufficiently representative, since it only follows 30 companies, unlike broader indices such as the S& P 500.
There are many factors that drive the Dow Jones Industrial Average (DJIA). The main one is the aggregate performance of its component companies, revealed in quarterly corporate earnings reports. US and global macroeconomic data also contribute, influencing investor sentiment. The level of interest rates, set by the Federal Reserve (Fed), also influences the DJIA, as it affects the cost of credit, on which many companies largely depend. Therefore, inflation can be a determining factor, as well as other parameters that influence the decisions of the Federal Reserve.
The Dow Theory is a method of identifying the main trend of the stock market developed by Charles Dow. A key step is to compare the direction of the Dow Jones Industrial Average (DJIA) and the Dow Jones Transportation Average (DJTA) and only follow trends where both are moving in the same direction. Volume is a confirmation criterion. The theory uses elements of maximum and minimum analysis. The Dow theory proposes three phases of the trend: accumulation, when the smart money begins to buy or sell; public participation, when the general public joins the trend; and distribution, when the smart money abandons the trend.
There are several ways to trade the DJIA. One of them is to use ETFs that allow investors to trade the DJIA as a single security, instead of having to buy shares of the 30 companies that comprise it. A prominent example is the SPDR Dow Jones Industrial Average ETF (DIA). Futures contracts on the DJIA allow traders to speculate on the future value of the index, and options provide the right, but not the obligation, to buy or sell the index at a predetermined price in the future. Mutual funds allow investors to purchase a portion of a diversified portfolio of DJIA securities, providing exposure to the global index.
Source: Fx Street
I am Joshua Winder, a senior-level journalist and editor at World Stock Market. I specialize in covering news related to the stock market and economic trends. With more than 8 years of experience in this field, I have become an expert in financial reporting.


