
- Dow Jones loses 0.27% in the day.
- The Nasdaq 100 falls 0.56% daily, oscillating within the range of the previous session.
- The S&P 500 slides 0.21%, after registering a new historical maximum in 6,129.
The Dow Jones reacted down from a maximum not seen since December 9, 2024 in 44,584, finding aggressive vendors that took the index to a minimum of the day in 44,379.
The Dow Jones industrial average opened at 44,584, while the Nasdaq 100 technological index began operating at 21,940. The S&P 500 began negotiations in 6,120, taking up the bassist perspective in tune with the main share rates.
The Dow Jones quotes down and ends with a streak of six consecutive days upwards
The Dow Jones index currently operates over 44,414, falling 0.27% and staying into the operational range of Thursday.
The titles of Nvidia (NVDA) have a fall of 3.34% today, reaching minimum of January 21 at $ 142.08, thus concluding with a streak of four consecutive sessions with profits.
On the other hand, the American Express values (AXP) go back 2.49% on Friday, reaching a minimum not seen since January 17 at 313.73 $ after making their quarterly report known. AXP obtained revenues for 17.18 billion dollars exceeding 17.14 billion dollars expected by consensus, as well as a gain per share of 3.04 $ compared to the $ 3.02 projected by analysts.
Texas Instruments and microchip Technology keep Nasdaq 100 on negative terrain
The Nasdaq 100 technological index falls 0.80% today, currently quoting over 21,719, consolidating in the previous session range.
Texas Instruments (TXN) shares slide with 7.40% operating currently operating in 185.89 $ The collapse in the price of its action is after the publication of its report that obtained 4.01 billion dollars compared to 3.9 thousand Millions of dollars planned by the market. Txn got an profit per share of $ 1.3, greater than the estimated $ 1.21. These results are insufficient for investors who punished the price of the action taking it to minimal not seen since January 2 at 185.03 $.
In the same tune, Microchip Technology (MCHP) loses 6.01% today, reaching minimum of January 16 in 55.75 $, leading losses in Nasdaq 100.
The S&P 500 see in negative terrain after the mixed results of the US S&P PMIs of the United States
The S&P 500 index decreases 0.21% in the last day of the week after registering a new historical maximum in 6,129, operating when writing in 6,093.
Based on the information presented by Markit Economics, the US S&P Services PMI stood at 52.8 points in January, below the 56.5 expected by the market and the 56.8 registered in the previous month. On the other hand, the Global S&P manufacturing PMI was 50.1, above 49.6 estimated and 49.4 recorded in December.
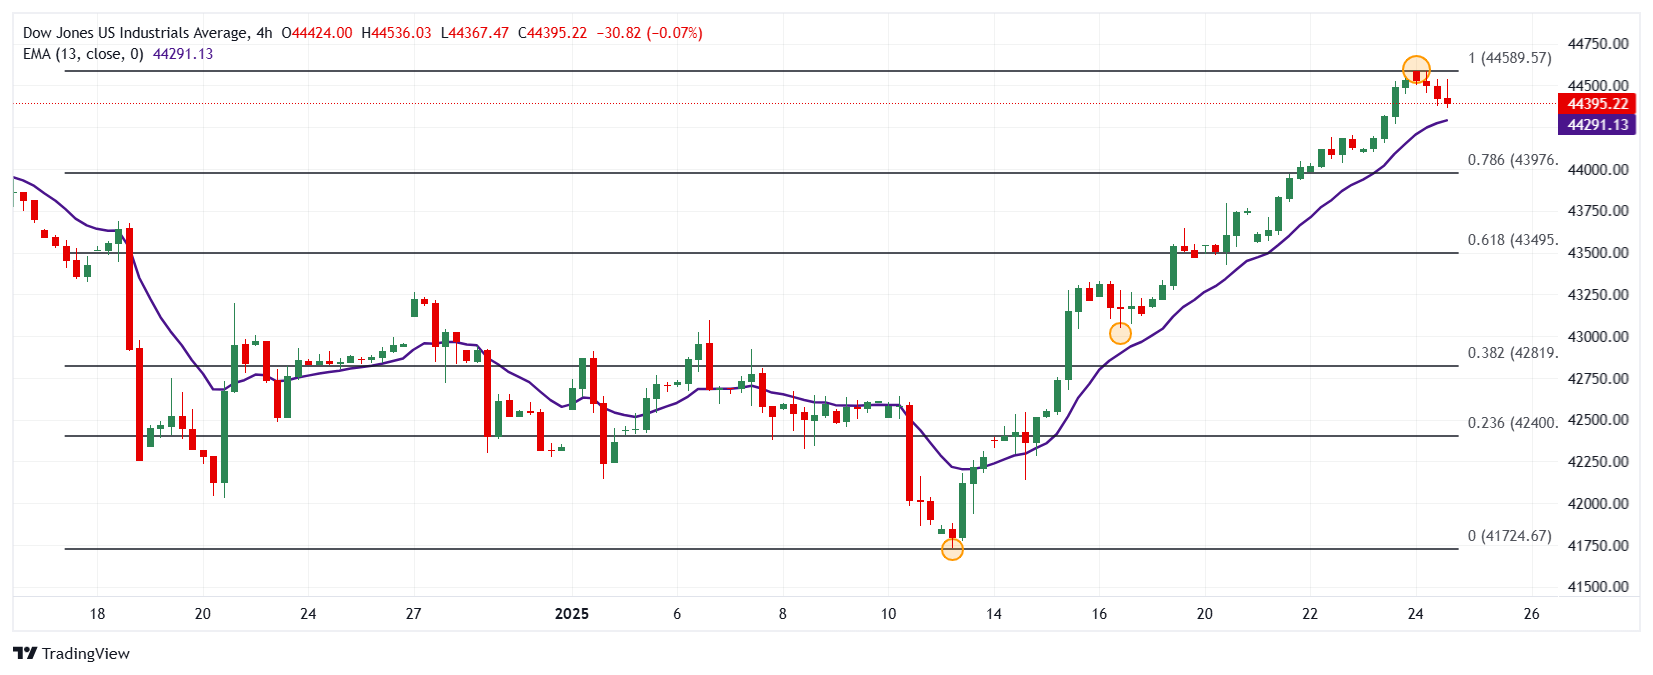
Technical Analysis of Dow Jones
The Dow Jones does not lower it in a short -term resistance given by the maximum of today in 44,584. The closest short -term support is found at 43,048 minimum of January 16. The following key support is found in 41,731 pivot point of January 13.
4 -hour graph of Dow Jones
Dow Jones Faqs
The Dow Jones Industrial Avenge, one of the oldest stock market indexes in the world, consists of the 30 most negotiated values in the United States. The index is weighted by the price instead of capitalization. It is calculated by adding the prices of the values that compose it and dividing them by a factor, currently 0.152. The index was founded by Charles Dow, also founder of the Wall Street Journal. In recent years it has been criticized for not being sufficiently representative, since it only follows 30 companies, unlike broader rates such as S&P 500.
There are many factors that promote the Dow Jones Industrial Average (DJIA) index. The main one is the added performance of the companies that compose it, revealed in the quarterly reports of business benefits. The American and world macroeconomic data also contribute, since they influence investor confidence. The level of interest rates, set by the Federal Reserve (FED), also influences the DJia, since it affects the cost of credit, on which many companies depend largely. Therefore, inflation can be a determining factor, as well as other parameters that influence the decisions of the Federal Reserve.
Dow’s theory is a method to identify the main trend of the stock market developed by Charles Dow. A key step is to compare the direction of the Dow Jones Industrial Avenge (DJIA) and the Dow Jones Transportation Average (DJTA) and just follow the trends in which both move in the same direction. The volume is a confirmation criterion. The theory uses elements of maximum and minimum analysis. Dow’s theory raises three phases of the trend: accumulation, when intelligent money begins to buy or sell; Public participation, when the general public joins the trend; and distribution, when intelligent money abandons the trend.
There are several ways to operate with the DJ. One of them is to use ETF that allow investors to negotiate the DJ as a single value, instead of having to buy shares of the 30 companies that compose it. An outstanding example is the SPDR Dow Jones Industrial Avenge ETF (day). Future contracts on the DJ allow the specular operators about the future value of the index and the options provide the right, but not the obligation, to buy or sell the index at a predetermined price in the future. Investment funds allow investors to buy a part of a diversified portfolio of DJ values, which provides exposure to global index.
Source: Fx Street
I am Joshua Winder, a senior-level journalist and editor at World Stock Market. I specialize in covering news related to the stock market and economic trends. With more than 8 years of experience in this field, I have become an expert in financial reporting.


