
- The Dow Jones falls 0.13% daily.
- The Nasdaq 100 rises 0.18% on the day.
- The S&P 500 fell 0.05% at the beginning of the day.
The Dow Jones operates with losses at the opening on Monday, in line with the main stock indices. Investors’ focus is on the United States elections, to be held on Tuesday.
The Dow Jones Industrial Average opened at 42,034, while the Nasdaq 100 technology index began trading at 20,136. The S&P 500 began trading at 5,748 amid widespread profit-taking in the markets.
The Dow Jones is trading in negative territory dragged by Intel and UnitedHealth
The Dow Jones Industrial Average registered a drop of 0.13%, trading at 41,928, consolidating within Friday’s operating range.
The semiconductor technology development company, Intel (INTC), loses 2.54% daily, trading at the time of writing above $22.60, while UnitedHealth (UNH) falls 1.46% on the day, trading at $559.88, reaching non-existent lows. seen since October 16.
Super Micro Computer and Dollar Tree keep the Nasdaq 100 in positive territory
The Nasdaq 100 technology index shows a gain of 0.18% today, supported by Dollar Tree (DLTR) and Super Micro Computer (SMCI)
The leading information technology company, Super Micro Computer (SMCI), rises 5.22% trading above $27.45 in line with Dollar Tree (DLTR), whose shares rise 4.56% reaching a maximum not seen since October 8.
The S&P 500 rises marginally ahead of the US presidential elections.
The S&P 500 stock index gains 0.05% on the day, remaining within the operating range of the previous session.
Investors will be attentive to the results of the presidential elections that will take place in the United States on Tuesday. Former president and presidential candidate Donald Trump presents a slight disadvantage against Republican candidate Kamala Harris in the most recent polls, with the New York Times giving a 49% preference to the Democratic leader compared to 48% given to Donald Trump.
On the other hand, Mosaic Company (MOS) rises 8.14%, trading at $29.02, visiting levels not seen since August 26.
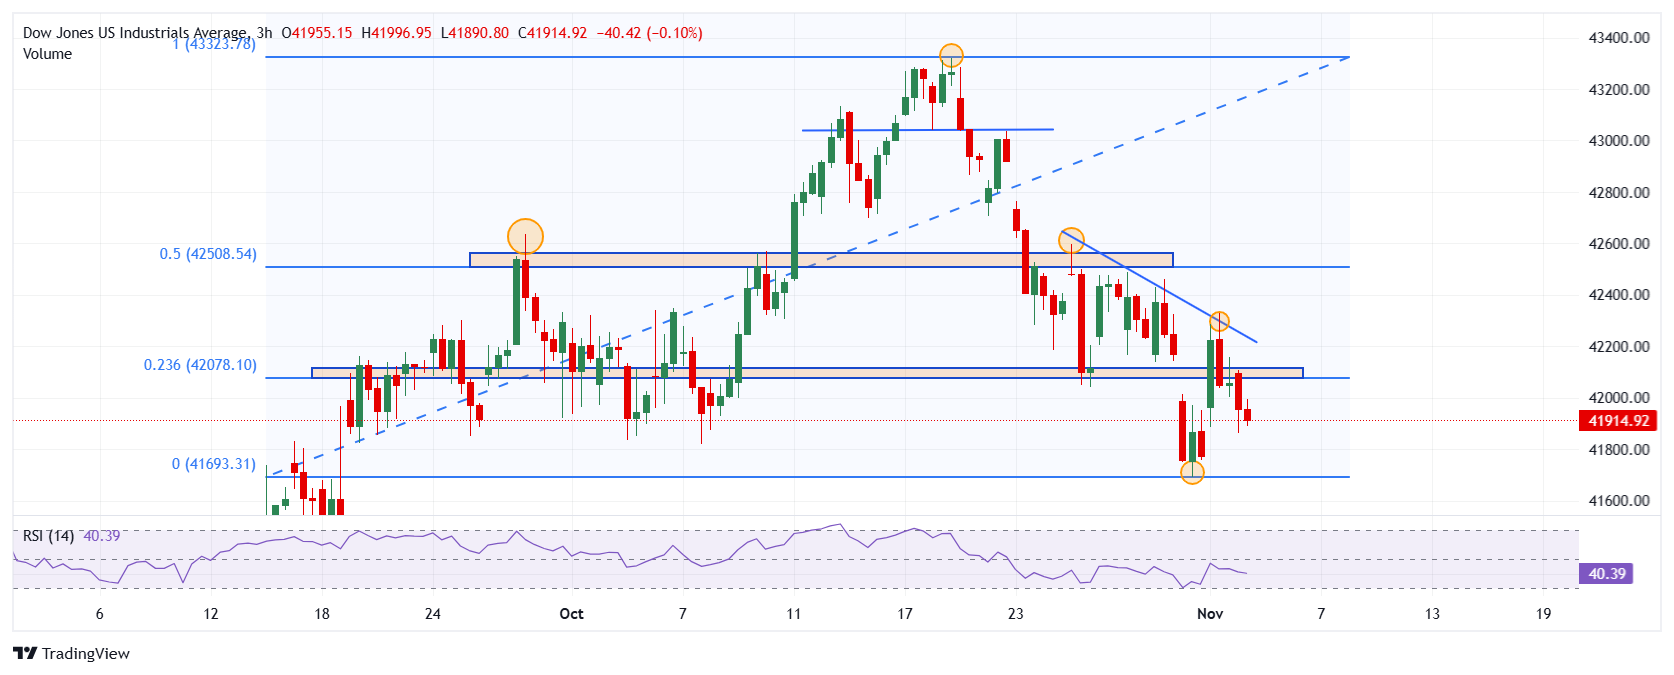
Technical analysis of the Dow Jones
The Dow Jones Industrial Average reacted lower at temporary resistance located at 42,596, given by the October 25 high in confluence with the 50% Fibonacci retracement. The next key resistance lies at 43322 all-time high reached on October 18.
On the downside, we see the closest support at 41,692. October 31 pivot. Its relative strength is at 40.39, slightly favoring sellers in the short term by being below the median line of 50.
Dow Jones 3-hour chart
The Dow Jones FAQs
The Dow Jones Industrial Average, one of the world’s oldest stock indices, is made up of the 30 most traded securities in the United States. The index is weighted by price rather than capitalization. It is calculated by adding the prices of the securities that comprise it and dividing them by a factor, currently 0.152. The index was founded by Charles Dow, also founder of the Wall Street Journal. In recent years it has been criticized for not being sufficiently representative, since it only follows 30 companies, unlike broader indices such as the S& P 500.
There are many factors that drive the Dow Jones Industrial Average (DJIA). The main one is the aggregate performance of its component companies, revealed in quarterly corporate earnings reports. US and global macroeconomic data also contribute, influencing investor sentiment. The level of interest rates, set by the Federal Reserve (Fed), also influences the DJIA, as it affects the cost of credit, on which many companies largely depend. Therefore, inflation can be a determining factor, as well as other parameters that influence the decisions of the Federal Reserve.
The Dow Theory is a method for identifying the main trend of the stock market developed by Charles Dow. A key step is to compare the direction of the Dow Jones Industrial Average (DJIA) and the Dow Jones Transportation Average (DJTA) and only follow trends where both are moving in the same direction. Volume is a confirmation criterion. The theory uses elements of maximum and minimum analysis. The Dow theory proposes three phases of the trend: accumulation, when the smart money begins to buy or sell; public participation, when the general public joins the trend; and distribution, when the smart money abandons the trend.
There are several ways to trade the DJIA. One of them is to use ETFs that allow investors to trade the DJIA as a single security, instead of having to buy shares of the 30 companies that comprise it. A prominent example is the SPDR Dow Jones Industrial Average ETF (DIA). Futures contracts on the DJIA allow traders to speculate on the future value of the index, and options provide the right, but not the obligation, to buy or sell the index at a predetermined price in the future. Mutual funds allow investors to purchase a portion of a diversified portfolio of DJIA securities, providing exposure to the global index.
Source: Fx Street
I am Joshua Winder, a senior-level journalist and editor at World Stock Market. I specialize in covering news related to the stock market and economic trends. With more than 8 years of experience in this field, I have become an expert in financial reporting.


