
- The Dow Jones is down 0.82% today.
- The Nasdaq 100 plummets 1.81% on the day.
- The S&P 500 falls 1.30% in the early stages of the American session.
The Dow Jones is trading lower at Wednesday’s opening, showing declines for the third consecutive day.
The Dow Jones Industrial Average (DJIA) opened the day at 42,017 points, while the Nasdaq technology index began trading at 20,280 and the S&P did so at 5,788, affected by the persistence of underlying inflation in personal consumption spending. PCEwhich was slightly above expectations.
The Dow Jones registers losses dragged by the fall of Microsoft, Amazon and Cisco
The Dow Jones index presents losses of 0.82%, trading at 41,808 points at the time of writing.
A more than 5% drop in Microsoft shares following yesterday’s earnings report is weighing on the index. Amazon is also falling, losing 1.76% after the opening of Wall Street, while Cisco Systems gives up 1.05%.
The Nasdaq 100 registers significant losses due to the fall in the shares of a large number of its companies
The Nasdaq is approaching losses of 2% in the first hours of the American session, now focused on the publication of the earnings report of Apple and Amazon, which are the focus of the day.
In addition to the sharp decline in Microsoft and Amazon, there were also falls in NVIDIA, which lost 3.66%, Meta, which lost 2.35%, and Broadcom, which lost 4.18%. Arm Holdings and Regeneron Pharmaceuticals are the ones that registered the largest declines, losing 6.87% and 9.98%, respectively.
S&P 500 declines as PCE inflation persists
The S&P 500 is currently losing just over 1.30%. The index has been affected by the US PCE personal consumption expenditure inflation data, which remained at 2.7% in October, above the expected 2.6%.
The United States has also published weekly jobless claims for the week of October 25, which stood at 216,000, improving on the previous 228,000 and the expected 230,000.
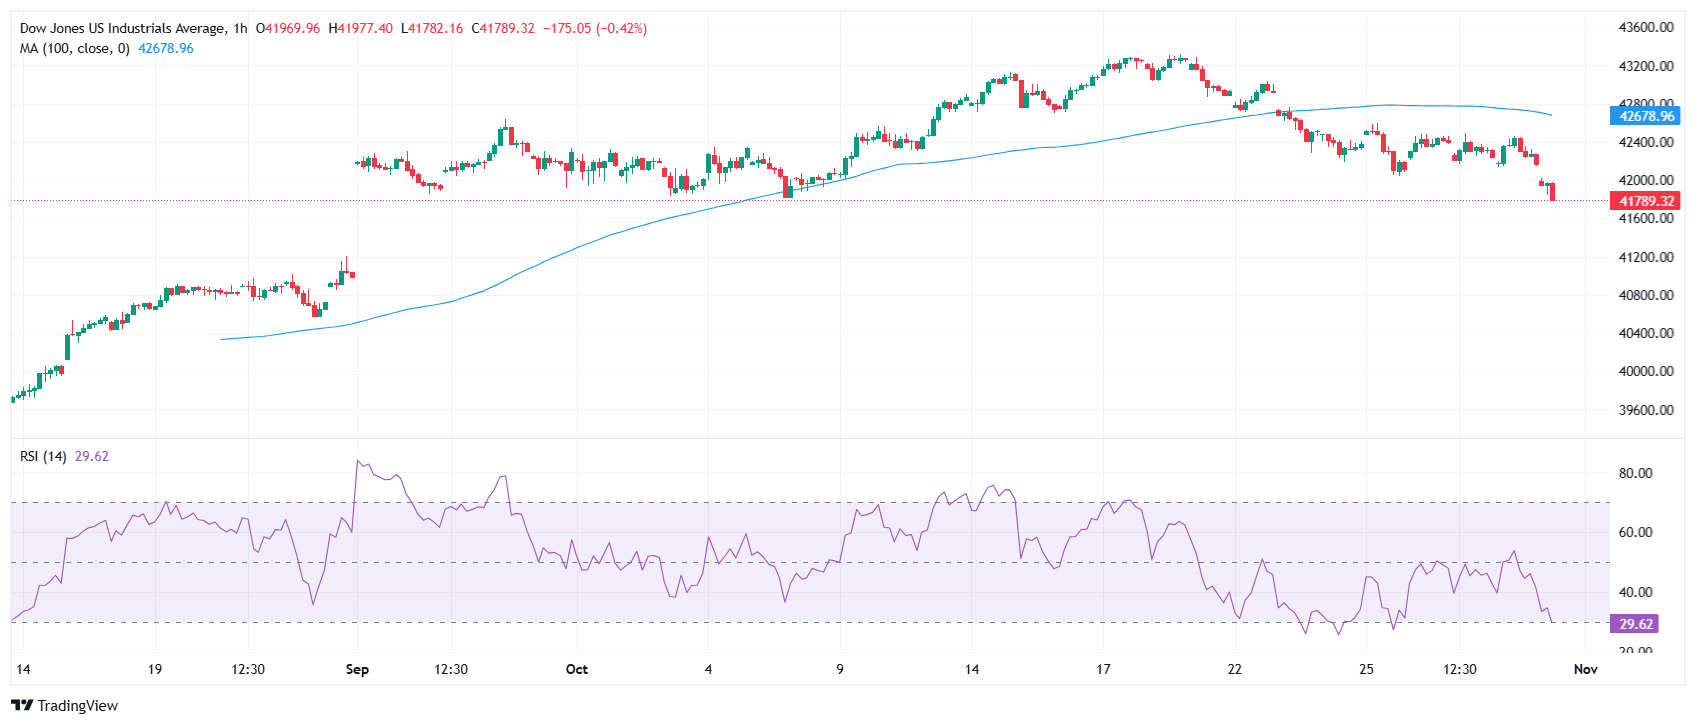
Technical analysis of the Dow Jones
The Dow Jones Industrial Average is finding support around 41,800 today, but a break of this area would target the 100-period moving average on the daily chart at 40,855 and the psychological zone of 40,000.
To the upside, initial resistance awaits at the 100-period moving average on one-hour chart around 42,679. Higher up, the all-time high of 43,322 is the main barrier to beat.
Dow Jones 1-hour chart
The Dow Jones FAQs
The Dow Jones Industrial Average, one of the world’s oldest stock indices, is made up of the 30 most traded securities in the United States. The index is weighted by price rather than capitalization. It is calculated by adding the prices of the securities that comprise it and dividing them by a factor, currently 0.152. The index was founded by Charles Dow, also founder of the Wall Street Journal. In recent years it has been criticized for not being sufficiently representative, since it only follows 30 companies, unlike broader indices such as the S& P 500.
There are many factors that drive the Dow Jones Industrial Average (DJIA). The main one is the aggregate performance of its component companies, revealed in quarterly corporate earnings reports. US and global macroeconomic data also contribute, influencing investor sentiment. The level of interest rates, set by the Federal Reserve (Fed), also influences the DJIA, as it affects the cost of credit, on which many companies largely depend. Therefore, inflation can be a determining factor, as well as other parameters that influence the decisions of the Federal Reserve.
The Dow Theory is a method for identifying the main trend of the stock market developed by Charles Dow. A key step is to compare the direction of the Dow Jones Industrial Average (DJIA) and the Dow Jones Transportation Average (DJTA) and only follow trends where they are both moving in the same direction. Volume is a confirmation criterion. The theory uses elements of maximum and minimum analysis. The Dow theory proposes three phases of the trend: accumulation, when the smart money begins to buy or sell; public participation, when the general public joins the trend; and distribution, when the smart money abandons the trend.
There are several ways to trade the DJIA. One of them is to use ETFs that allow investors to trade the DJIA as a single security, instead of having to buy shares of the 30 companies that comprise it. A prominent example is the SPDR Dow Jones Industrial Average ETF (DIA). Futures contracts on the DJIA allow traders to speculate on the future value of the index, and options provide the right, but not the obligation, to buy or sell the index at a predetermined price in the future. Mutual funds allow investors to purchase a portion of a diversified portfolio of DJIA securities, providing exposure to the global index.
Source: Fx Street
I am Joshua Winder, a senior-level journalist and editor at World Stock Market. I specialize in covering news related to the stock market and economic trends. With more than 8 years of experience in this field, I have become an expert in financial reporting.


