
- The Dow Jones gains 0.14% daily.
- The Nasdaq 100 falls 0.43% on the day.
- The S&P 500 marginally lost 0.09% on Wednesday.
The Dow Jones is trading higher after it was announced that US inflation was in line with analyst estimates at 2.6% for October.
The Dow Jones Industrial Average began trading at 43,880, while the Nasdaq 100 technology index began trading at 21,092. The S&P 500 opened the session at 5,985. Investors will be attentive to the speeches of the members of the Fed that will be presented later today.
The Dow Jones remains in positive territory, encouraged by Home Depot and 3M
The Dow Jones Industrial Average registers a rise of 0.14% on the day, currently trading at 43,956, consolidating within the operating range of the previous session.
Home Depot (HD) leads the gains in the index, appreciating 1.55% today, trading above $410.16. In the same vein, 3M (MMM) rises 0.96% daily, trading at $131.49.
The Nasdaq 100 is dragged into the negative zone by KLA Corp and Moderna
The Nasdaq 100 technology index lost 0.43% in Wednesday’s session, signing its third consecutive session down, trading at 21,011 at the time of writing.
KLA Corporation (KLAC) falls 3.52% daily, reaching lows not seen since April 23 at $638.32. On the other hand, the company focused on the development of biotechnology, Moderna (MRNA), has resumed the downward trend and presents a drop of 3.57% on the day, reaching lows not seen since April 16, 2020.
The S&P 500 is trading lower, weighed down by Monolithic Power Systems and Skyworks Solutions
The S&P 500 stock index operates with marginal losses of 0.09% today, after it was announced that inflation in the United States remained in line with the projections expected by analysts at 2.6%, increasing two tenths from 2.4 % achieved in your previous reading.
Monolithic Power Systems (MPWR) shares fall 3.88%, hitting two-day lows of $612.81. On the other hand, Skyworks Solutions shares lose 3.58% daily, reaching lows not seen since November 3, 2022.
The market will be attentive to the speeches to be held throughout the day by Alberto Musalem, president of the St. Louis Federal Reserve and Jeff Schmid, president of the Kansas Federal Reserve.
Technical analysis of the S&P 500
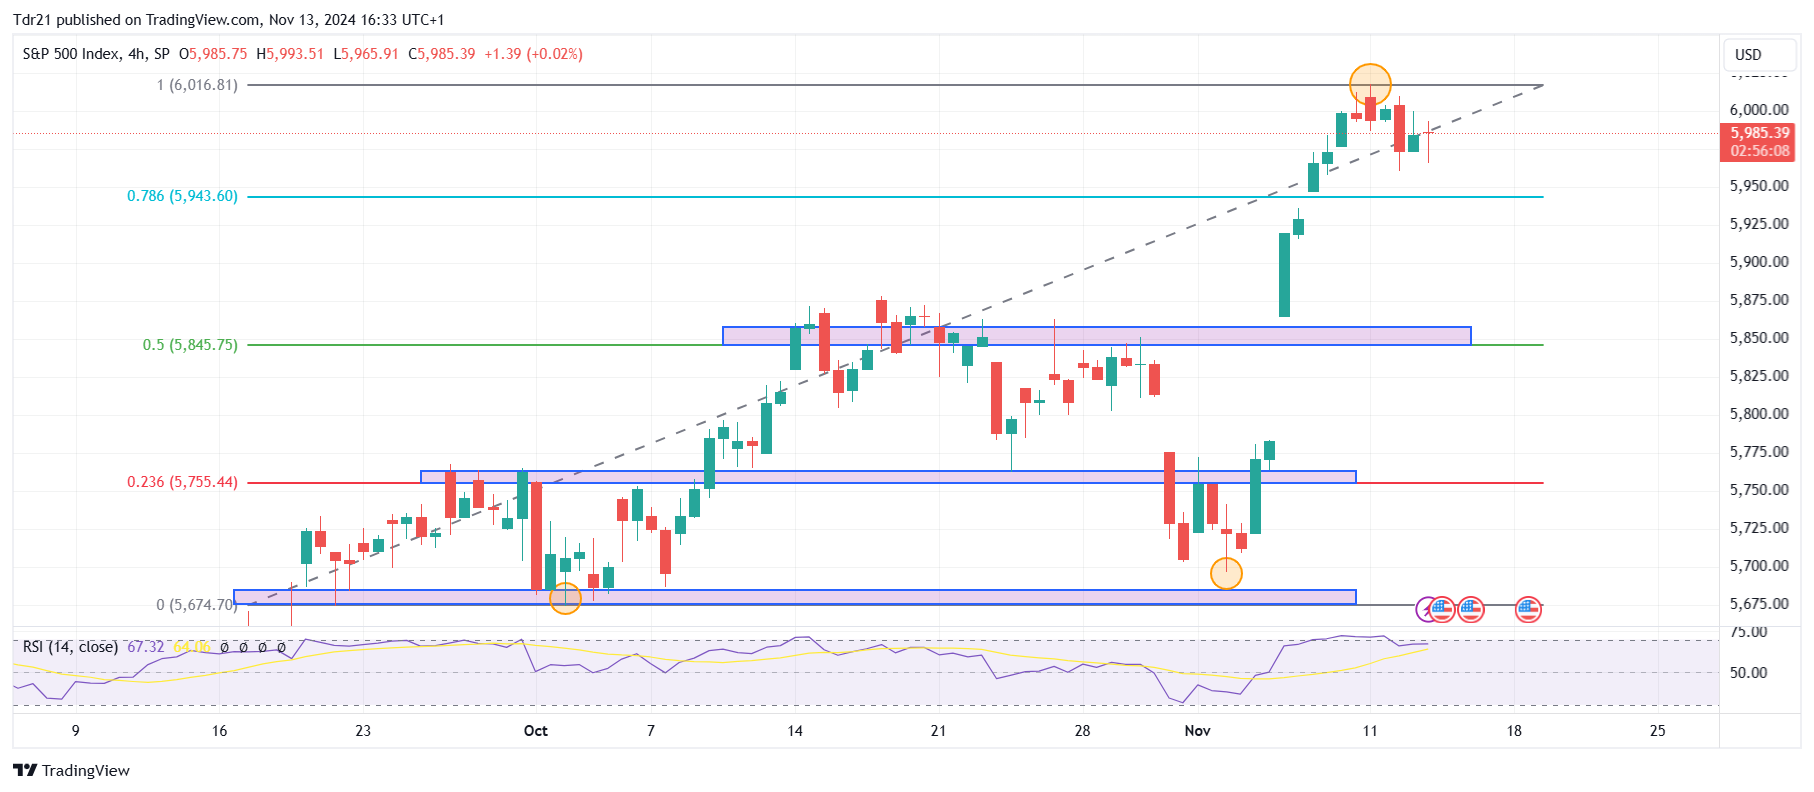
The S&P 500 reacted lower into short-term resistance formed by the all-time high reached on November 11 at 6,017. On the downside, we see the first support zone at 5,850, given by the 50% Fibonacci retracement and close to the minimum of November 6. The next key support zone is at 5,674, the October 2 pivot point.
S&P 500 daily chart
The Dow Jones FAQs
The Dow Jones Industrial Average, one of the world’s oldest stock indices, is made up of the 30 most traded securities in the United States. The index is weighted by price rather than capitalization. It is calculated by adding the prices of the securities that comprise it and dividing them by a factor, currently 0.152. The index was founded by Charles Dow, also founder of the Wall Street Journal. In recent years it has been criticized for not being sufficiently representative, since it only follows 30 companies, unlike broader indices such as the S& P 500.
There are many factors that drive the Dow Jones Industrial Average (DJIA). The main one is the aggregate performance of its component companies, revealed in quarterly corporate earnings reports. US and global macroeconomic data also contribute, influencing investor sentiment. The level of interest rates, set by the Federal Reserve (Fed), also influences the DJIA, as it affects the cost of credit, on which many companies largely depend. Therefore, inflation can be a determining factor, as well as other parameters that influence the decisions of the Federal Reserve.
The Dow Theory is a method for identifying the main trend of the stock market developed by Charles Dow. A key step is to compare the direction of the Dow Jones Industrial Average (DJIA) and the Dow Jones Transportation Average (DJTA) and only follow trends where they are both moving in the same direction. Volume is a confirmation criterion. The theory uses elements of maximum and minimum analysis. The Dow theory proposes three phases of the trend: accumulation, when the smart money begins to buy or sell; public participation, when the general public joins the trend; and distribution, when the smart money abandons the trend.
There are several ways to trade the DJIA. One of them is to use ETFs that allow investors to trade the DJIA as a single security, instead of having to buy shares of the 30 companies that comprise it. A prominent example is the SPDR Dow Jones Industrial Average ETF (DIA). Futures contracts on the DJIA allow traders to speculate on the future value of the index, and options provide the right, but not the obligation, to buy or sell the index at a predetermined price in the future. Mutual funds allow investors to purchase a portion of a diversified portfolio of DJIA securities, providing exposure to the global index.
Source: Fx Street
I am Joshua Winder, a senior-level journalist and editor at World Stock Market. I specialize in covering news related to the stock market and economic trends. With more than 8 years of experience in this field, I have become an expert in financial reporting.


