
- The Dow Jones wins 0.50% in the day.
- The Nasdaq 100 goes back 0.43% today, weighed by PDD Holdings (PDD).
- The S&P 500 rises 0.04% on Monday, driven by Berkshire Hathaway (BRK.B).
The Dow Jones established a minimum of the day in 43,350, where buyers attracted the index to a daily maximum in 43,754.
The Dow Jones industrial average opened in 43,638, while the Nasdaq 100 technological index began operating at 22,069. The S&P 500 began negotiations in 5,979, reaching minimal not seen since February 4 in 5,979.
The Dow Jones operates in positive field animated by Nike
The Dow Jones index rises 0.50% daily, quoting at the time of writing about 43,669, staying within the operational range of the previous session.
Nike (NKE) shares earn 5.55% in the day, reaching maximums not seen since December 6, 2024 in 81.09 $. The rebound in the price of its action is given after the update its objective price by the Financial Intermediary Jefferies at $ 115.
In the same tuning, The Travelers Companies (TRV) titles have a 3.68% rise today, ending with two consecutive days down, reaching maximums not seen since February 6 at 249.09 $.
The Nasdaq 100 is quoted in a negative zone dragged by PDD Holdings and Palantir Technologies
The Nasdaq 100 technological index loses 0.43% on Monday, falling to minimum of February 5 in 21,377, spinning its third consecutive session with losses.
PDD Holdings (PDD) values collapse 9.30% daily, visiting minimums of February 13 at $ 118.69. Following the bearish perspective, the actions of Palantir Technologies (PLT) fall 8.88% that today, signing its second consecutive day downward, establishing a minimum of the day at 89.30 $.
In this context, the Nasdaq 100 extends the losses of last week, pointing to the key support area located in 20,800.
Berkshire Hathaway drives S&P 500 to profit zone
The S&P 500 index has a marginal gain of 0.04% on the first day of the week, bouncing from February 4 at 5,979.
Berkshire Hathaway (BRK.B) values are fired by 5.02% today, establishing a new historical maximum in 503.96 $ after the publication of its profit report. BRK.B obtained income for 94.92 billion dollars compared to 92.16 billion expected dollars, as well as a gain per share of $ 6,744, exceeding $ 4,624 projected by analysts.
In the same tonic, Walgreens Boots Alliance (WBA) shares rise 6.15%, reaching maximum of February 20 at 10.84 $.
On the other hand, the US economic agenda highlights the publication of its Gross Domestic Product on Thursday, waiting for EM 2.3%to be placed, matching the registration of the previous period.
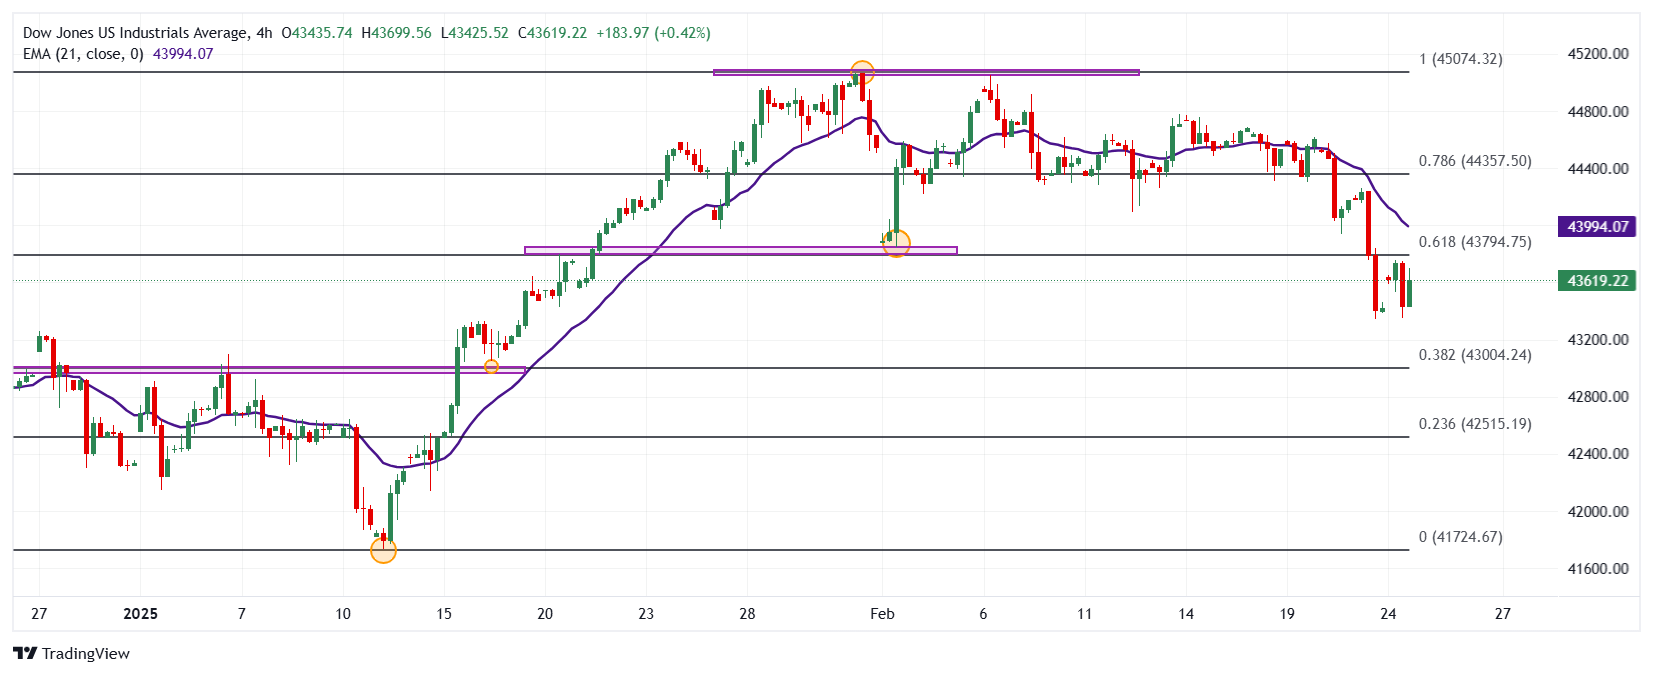
Technical Analysis of Dow Jones
The Dow Jones established a short -term resistance given by the maximum of January 31 at 45,068. Down, the closest support is at 43,048 minimum of January 16. The following important support is found in 41,731, a pivot point of January 13.
4 -hour graph of Dow Jones
Dow Jones Faqs
The Dow Jones Industrial Avenge, one of the oldest stock market indexes in the world, consists of the 30 most negotiated values in the United States. The index is weighted by the price instead of capitalization. It is calculated by adding the prices of the values that compose it and dividing them by a factor, currently 0.152. The index was founded by Charles Dow, also founder of the Wall Street Journal. In recent years it has been criticized for not being sufficiently representative, since it only follows 30 companies, unlike broader rates such as S&P 500.
There are many factors that promote the Dow Jones Industrial Average (DJIA) index. The main one is the added performance of the companies that compose it, revealed in the quarterly reports of business benefits. The American and world macroeconomic data also contribute, since they influence investor confidence. The level of interest rates, set by the Federal Reserve (FED), also influences the DJia, since it affects the cost of credit, on which many companies depend largely. Therefore, inflation can be a determining factor, as well as other parameters that influence the decisions of the Federal Reserve.
Dow’s theory is a method to identify the main trend of the stock market developed by Charles Dow. A key step is to compare the direction of the Dow Jones Industrial Avenge (DJIA) and the Dow Jones Transportation Average (DJTA) and just follow the trends in which both move in the same direction. The volume is a confirmation criterion. The theory uses elements of maximum and minimum analysis. Dow’s theory raises three phases of the trend: accumulation, when intelligent money begins to buy or sell; Public participation, when the general public joins the trend; and distribution, when intelligent money abandons the trend.
There are several ways to operate with the DJ. One of them is to use ETF that allow investors to negotiate the DJ as a single value, instead of having to buy shares of the 30 companies that compose it. An outstanding example is the SPDR Dow Jones Industrial Avenge ETF (day). Future contracts on the DJ allow the specular operators about the future value of the index and the options provide the right, but not the obligation, to buy or sell the index at a predetermined price in the future. Investment funds allow investors to buy a part of a diversified portfolio of DJ values, which provides exposure to global index.
Source: Fx Street
I am Joshua Winder, a senior-level journalist and editor at World Stock Market. I specialize in covering news related to the stock market and economic trends. With more than 8 years of experience in this field, I have become an expert in financial reporting.


