
- The Dow Jones falls 0.89% daily.
- The Nasdaq 100 loses 2.49% on the day.
- The S&P 500 fell 1.40% on Friday.
The Dow Jones is trading lower following the publication of US retail sales for October and statements by Susan Collins, president of the Boston Federal Reserve, stating that a rate cut in December is not possible. insured.
The Dow Jones Industrial Average began trading above 43,694, while the Nasdaq 100 technology index opened at 20,900. The S&P 500 began the day at 5,937, reaching lows in more than a week.
Amgen and Amazon drag the Dow Jones into negative territory
The Dow Jones Industrial Average registered a loss of 0.89% in today’s session, signing its second consecutive session down, currently trading above 43,389.
Amazon (AMZN) falls 4.46%, trading at $201.71, reaching lows not seen since November 6. Following the bearish trend, Amgen (AMGN) shares plummet 5.08% on the day, trading at $280.76, ending a streak of five consecutive sessions with Cuba losses and reaching a minimum not seen since May 2 at 279.62 %.
Applied Materials drags Nasdaq 100 to more than one-week lows
The Nasdaq 100 technology index fell 2.49% on Friday, currently trading above 20,372, in line with the main stock indices.
Applied Materials (AMAT) shares plunge 8.70% today, hitting more than nine-month lows. The fall in the price of AMAT shares occurs after the publication of its quarterly report, obtaining revenues of 7.05 billion dollars compared to 6.96 billion dollars and an earnings per share of $2.32, above the expected $2.19 by analysts.
Despite beating market expectations in its earnings report, investors have been dissatisfied with the company’s future projections, driving the stock price to lows not seen since February 2 at $167.33.
The S&P 500 operates in negative territory after statements by Fed members
The S&P 500 stock index falls 1.46%, currently trading at 5,864, ending the week with a loss of 2.25%. When the fall in the stock index occurs after statements by the president of the Federal Reserve, Jerome Powell, mentioning that there is no rush for an interest rate cut by the monetary authority.
Along the same lines, the president of the Boston Fed, Susan Collins, highlighted in an interview that a rate reduction in December is not guaranteed, as long as there are no signs of pressure on prices.
On the other hand, US retail sales stood at 0.4% in October, slightly above analysts’ projections of 0.3%, although below the 0.8% recorded in September.
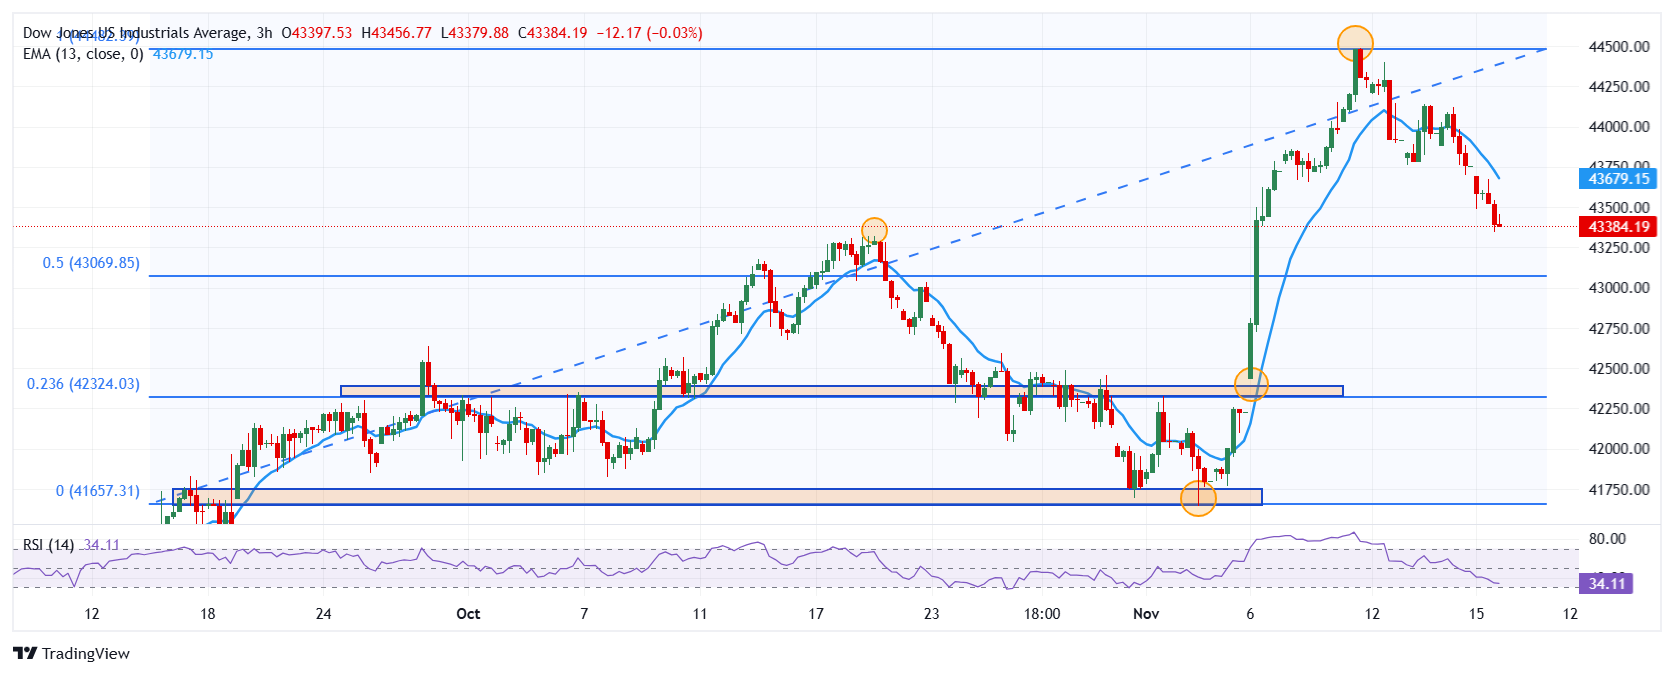
Technical analysis of the Dow Jones
The Dow Jones reacted lower at short-term resistance set by the Nov. 11 high at 44,482. We see the first support zone at 42.439, the minimum of November 6, which coincides with the 23.6% Fibonacci retracement. The next key support zone is located at 41,641, the pivot point of November 4.
Dow Jones 4-hour chart
The Dow Jones FAQs
The Dow Jones Industrial Average, one of the world’s oldest stock indices, is made up of the 30 most traded securities in the United States. The index is weighted by price rather than capitalization. It is calculated by adding the prices of the securities that comprise it and dividing them by a factor, currently 0.152. The index was founded by Charles Dow, also founder of the Wall Street Journal. In recent years it has been criticized for not being sufficiently representative, since it only follows 30 companies, unlike broader indices such as the S& P 500.
There are many factors that drive the Dow Jones Industrial Average (DJIA). The main one is the aggregate performance of its component companies, revealed in quarterly corporate earnings reports. US and global macroeconomic data also contribute, influencing investor sentiment. The level of interest rates, set by the Federal Reserve (Fed), also influences the DJIA, as it affects the cost of credit, on which many companies largely depend. Therefore, inflation can be a determining factor, as well as other parameters that influence the decisions of the Federal Reserve.
The Dow Theory is a method for identifying the main trend of the stock market developed by Charles Dow. A key step is to compare the direction of the Dow Jones Industrial Average (DJIA) and the Dow Jones Transportation Average (DJTA) and only follow trends where they are both moving in the same direction. Volume is a confirmation criterion. The theory uses elements of maximum and minimum analysis. The Dow theory proposes three phases of the trend: accumulation, when the smart money begins to buy or sell; public participation, when the general public joins the trend; and distribution, when the smart money abandons the trend.
There are several ways to trade the DJIA. One of them is to use ETFs that allow investors to trade the DJIA as a single security, instead of having to buy shares of the 30 companies that comprise it. A prominent example is the SPDR Dow Jones Industrial Average ETF (DIA). Futures contracts on the DJIA allow traders to speculate on the future value of the index, and options provide the right, but not the obligation, to buy or sell the index at a predetermined price in the future. Mutual funds allow investors to purchase a portion of a diversified portfolio of DJIA securities, providing exposure to the global index.
Source: Fx Street
I am Joshua Winder, a senior-level journalist and editor at World Stock Market. I specialize in covering news related to the stock market and economic trends. With more than 8 years of experience in this field, I have become an expert in financial reporting.


