
- The Dow Jones fell 0.58% on Thursday.
- The Nasdaq 100 loses 1.58% today.
- The S&P 500 falls 1.06% on the day.
The Dow Jones hit a daily high of 42,913, where it attracted sellers that dragged the index to a near two-week low of 42,180.
The Dow Jones Industrial Average opened at 42,520, while the Nasdaq 100 technology index began trading at 21,158. The S&P 500 began trading at 5,893, maintaining the bearish outlook in the short term.
Boeing and Apple keep the Dow Jones in the negative zone
The Dow Jones Industrial Average is currently trading above 42.258, losing 0.58% on the day, consolidating at December 20 lows at 42.180.
Shares of aircraft manufacturer Boeing (BA) fell 3.86% daily, reaching more than two-week lows not seen since December 16 at $169.82. In the same vein, Apple shares (AAPL) lost 3.05% on Thursday, signing their third consecutive session trading downwards, reaching the lows of December 9 at $242.30.
The Nasdaq 100 is trading lower, dragged down by Tesla and Workday
The Nasdaq 100 technology index presents a loss of 1.58% today, trading at the time of writing at 20,817, reaching almost two-week lows at 21,789.
Tesla (TSLA) shares plummeted 6.87% on the first trading day of the year, stringing together five consecutive sessions with losses and reaching one-month lows of $373.04. On the other hand, Workday (WDAY) values lost 2.68% today, reaching levels not seen since December 2 at $250.09, marking four consecutive days of decline.
S&P 500 slides strongly and hits two-week lows
The S&P 500 index loses 1.06% in the first trading session of the year, reaching the lows of December 20 at 5,827.
According to information provided by the United States Department of Labor, weekly claims for unemployment benefits stood at 211,000 in the week ending December 27, below the estimated 222,000 and the 220,000 recorded the previous week.
Investors will be attentive to the ISM manufacturing PMI for December to be published tomorrow, the consensus expects it to be at 48.4 equaling the figure reached in November.
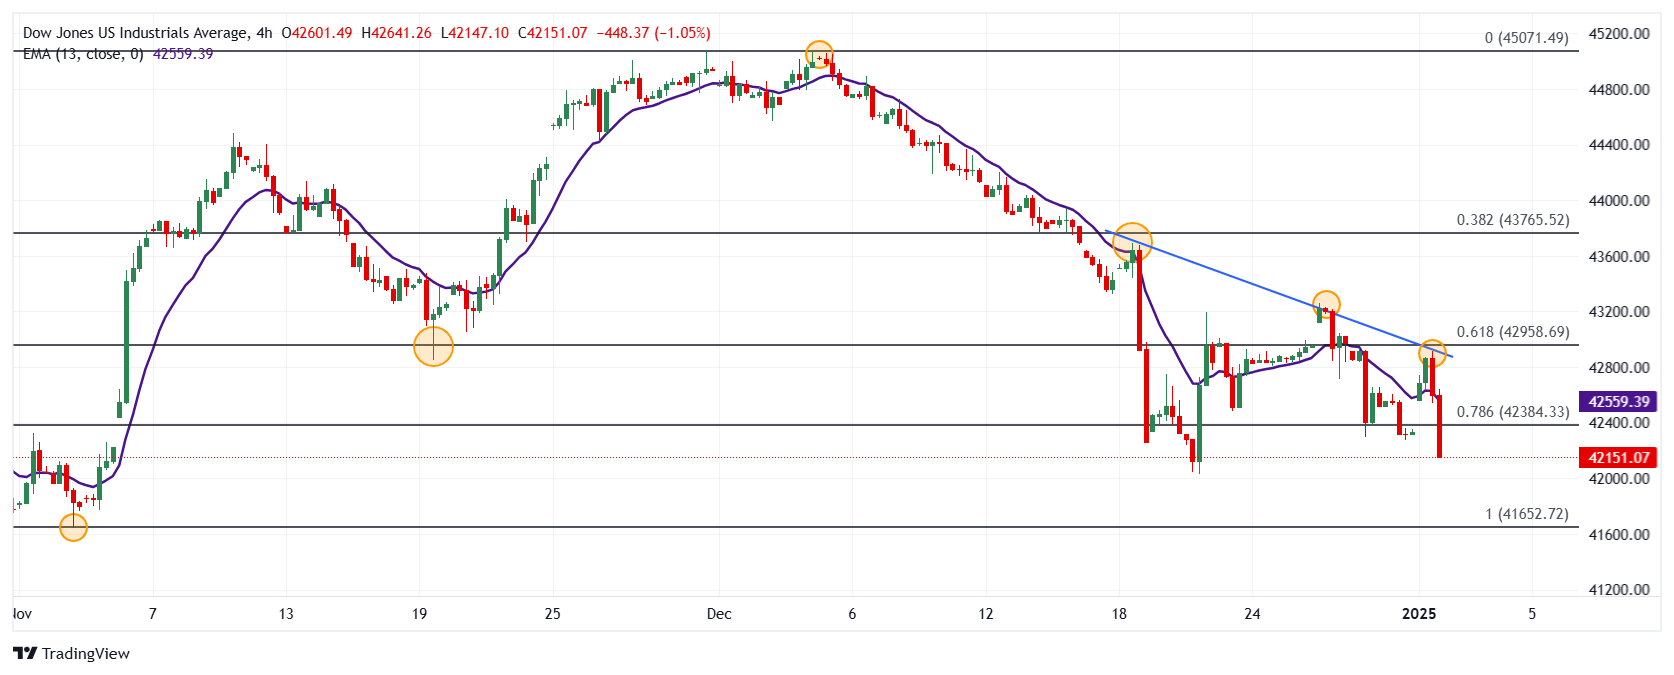
Technical analysis of the Dow Jones
The Dow Jones established short-term resistance given by the December 18 high at 4,369, close to the 38.2% Fibonacci retracement. The next key resistance is seen at 45,065, the December 4 high. On the downside, important support is at 41,641, the pivot point of November 4.
Dow Jones 4-hour chart
Dow Jones FAQs
The Dow Jones Industrial Average, one of the world’s oldest stock indices, is made up of the 30 most traded securities in the United States. The index is weighted by price rather than capitalization. It is calculated by adding the prices of the securities that comprise it and dividing them by a factor, currently 0.152. The index was founded by Charles Dow, also founder of the Wall Street Journal. In recent years it has been criticized for not being sufficiently representative, since it only follows 30 companies, unlike broader indices such as the S& P 500.
There are many factors that drive the Dow Jones Industrial Average (DJIA). The main one is the aggregate performance of its component companies, revealed in quarterly corporate earnings reports. US and global macroeconomic data also contribute, influencing investor sentiment. The level of interest rates, set by the Federal Reserve (Fed), also influences the DJIA, as it affects the cost of credit, on which many companies largely depend. Therefore, inflation can be a determining factor, as well as other parameters that influence the decisions of the Federal Reserve.
The Dow Theory is a method for identifying the main trend of the stock market developed by Charles Dow. A key step is to compare the direction of the Dow Jones Industrial Average (DJIA) and the Dow Jones Transportation Average (DJTA) and only follow trends where they are both moving in the same direction. Volume is a confirmation criterion. The theory uses elements of maximum and minimum analysis. The Dow theory proposes three phases of the trend: accumulation, when the smart money begins to buy or sell; public participation, when the general public joins the trend; and distribution, when the smart money abandons the trend.
There are several ways to trade the DJIA. One of them is to use ETFs that allow investors to trade the DJIA as a single security, instead of having to buy shares of the 30 companies that comprise it. A prominent example is the SPDR Dow Jones Industrial Average ETF (DIA). Futures contracts on the DJIA allow traders to speculate on the future value of the index, and options provide the right, but not the obligation, to buy or sell the index at a predetermined price in the future. Mutual funds allow investors to purchase a portion of a diversified portfolio of DJIA securities, providing exposure to the global index.
Source: Fx Street
I am Joshua Winder, a senior-level journalist and editor at World Stock Market. I specialize in covering news related to the stock market and economic trends. With more than 8 years of experience in this field, I have become an expert in financial reporting.


