
- The Dow Jones fall 1.55% daily, contributing currently about 39,053.
- The Nasdaq 100 loses 0.21% in the day, dragged by Nvidia Corporation (NVDA).
- The S&P 500 falls 0.04% on Thursday, staying within Wednesday’s operational range in 5,270.
- The manufacturing index of the Fed of Philadelphia collapses to -26.4 in April, its worst level in two years.
- The weekly applications of unemployment subsidy were 215,000 in the week that ended on April 12.
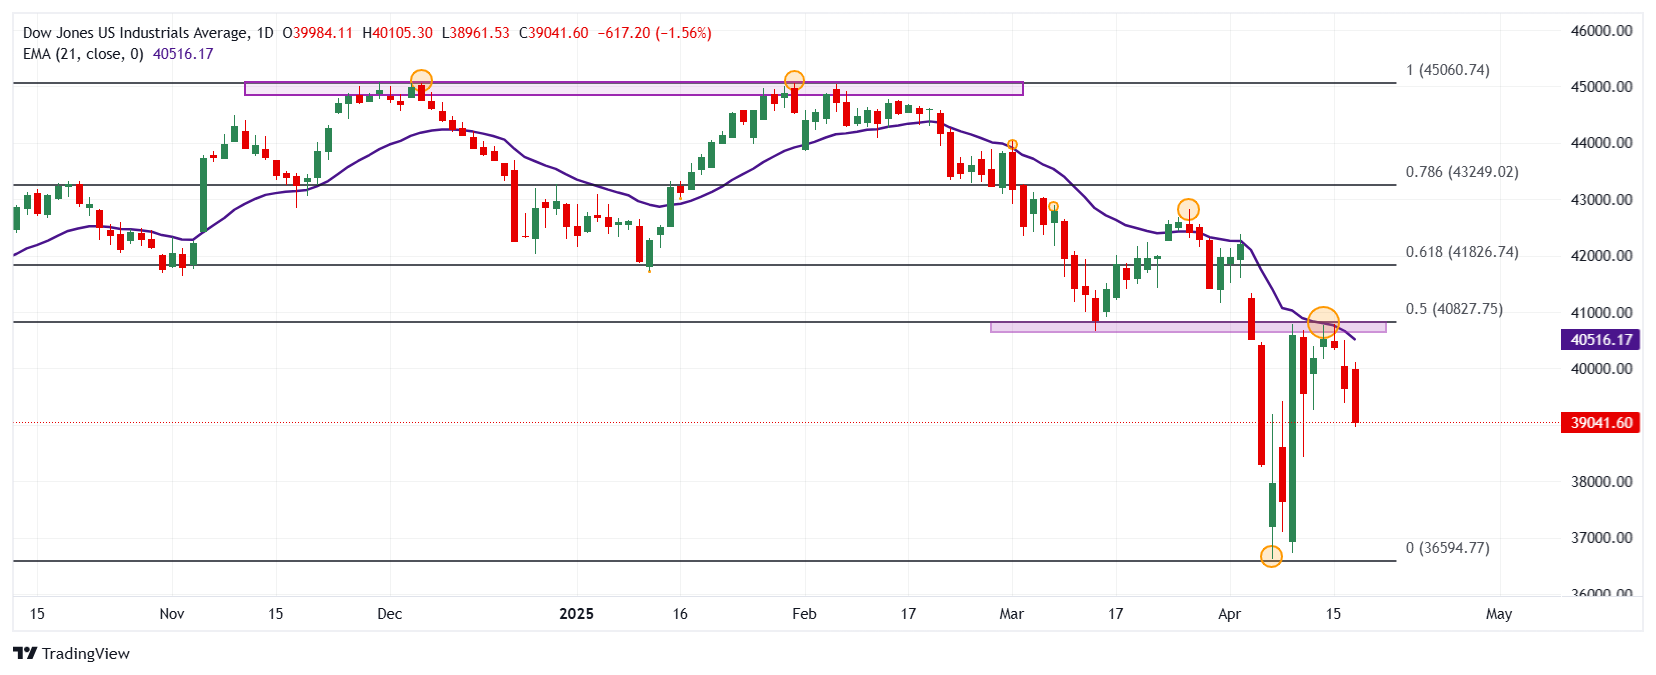
The Dow Jones establishes a maximum of the day in 40,115, finding vendors to aggressive who took the index to minimums not seen since April 10 in 38,961.
The Dow Jones industrial average began operating at 39,384, while the Nasdaq 100 technological index opened in 18,352. The S&P 500 began negotiations in 5,298, consolidating within the operational range of Wednesday’s session.
UnitedHealth drags Dow Jones in a negative zone
The Dow Jones index loses 1.55% today, reaching minimums of one week not seen since April 10 at 38,961.
The titles of UnitedHealth (UNH) collapse 19.81% in the day, reaching minimums not seen since March 4 in 468.51 $ after the publication of its profits. UNH reported income 109.58 billion dollars, below 111.58 billion dollars expected. Similarly, it got an profit per share of $ 7.20 compared to $ 7,292 projected by the market.
In the same tonic, Amgen’s titles (AMGN) fall 3.29% on Thursday, reaching a minimum of April 9 at 268.50 $, signing its second consecutive day down.
The Dow Jones goes back 484 points daily, spinning three consecutive days with losses.
Nvidia Corporation and Micron Technology keep Nasdaq 100 in a negative zone
The Nasdaq 100 technological index loses 0.41% in the day, consolidating within Wednesday’s operational range in 18,171.
The titles of Nvidia Corporation (NVDA) have a daily loss of 4.12%, reaching a minimum of April 10 in 100.13, spinning its second consecutive day down.
In the same tune the shares of micron technology (MU) decrease 3.01%, currently operating over $ 67.24, reaching minimum of April 11.
The Nasdaq 100 falls 108 points today, signing two consecutive sessions with losses, in tune with the main share rates.
The S&P 500 operates in negative terrain after mixed economic data of the USA.
The S&P 500 signs its third consecutive day down, losing 0.04%, quoting at the time of writing in 5,270.
The manufacturing index of the Federal Reserve of Philadelphia collapses to -26.4 in April, reaching its lowest level in two years, worsening the expectations of 2 points and the previous record of 12.5.
At the same time, the weekly applications of unemployment subsidy were located in 215,000 in the week that ended on April 12, located below the estimated 225,000 and 224,000 of the previous week.
In this context, the S&P 500 goes back 8 points, reaching a daily minimum in 5,254.
Technical Analysis of Dow Jones
The Dow Jones established a short -term resistance given by the maximum of April 14 in 40,774. The next important resistance is 42,820 maximum of March 26. Down, the Calve support is 36.614, a pivot point of April 7.
Dow Jones daily graphics
Dow Jones Faqs
The Dow Jones Industrial Avenge, one of the oldest stock market indexes in the world, consists of the 30 most negotiated values in the United States. The index is weighted by the price instead of capitalization. It is calculated by adding the prices of the values that compose it and dividing them by a factor, currently 0.152. The index was founded by Charles Dow, also founder of the Wall Street Journal. In recent years it has been criticized for not being sufficiently representative, since it only follows 30 companies, unlike broader rates such as S&P 500.
There are many factors that promote the Dow Jones Industrial Average (DJIA) index. The main one is the added performance of the companies that compose it, revealed in the quarterly reports of business benefits. The American and world macroeconomic data also contribute, since they influence investor confidence. The level of interest rates, set by the Federal Reserve (FED), also influences the DJia, since it affects the cost of credit, on which many companies depend largely. Therefore, inflation can be a determining factor, as well as other parameters that influence the decisions of the Federal Reserve.
Dow’s theory is a method to identify the main trend of the stock market developed by Charles Dow. A key step is to compare the direction of the Dow Jones Industrial Avenge (DJIA) and the Dow Jones Transportation Average (DJTA) and just follow the trends in which both move in the same direction. The volume is a confirmation criterion. The theory uses elements of maximum and minimum analysis. Dow’s theory raises three phases of the trend: accumulation, when intelligent money begins to buy or sell; Public participation, when the general public joins the trend; and distribution, when intelligent money abandons the trend.
There are several ways to operate with the DJ. One of them is to use ETF that allow investors to negotiate the DJ as a single value, instead of having to buy shares of the 30 companies that compose it. An outstanding example is the SPDR Dow Jones Industrial Avenge ETF (day). Future contracts on the DJ allow the specular operators about the future value of the index and the options provide the right, but not the obligation, to buy or sell the index at a predetermined price in the future. Investment funds allow investors to buy a part of a diversified portfolio of DJ values, which provides exposure to global index.
Source: Fx Street
I am Joshua Winder, a senior-level journalist and editor at World Stock Market. I specialize in covering news related to the stock market and economic trends. With more than 8 years of experience in this field, I have become an expert in financial reporting.


