
- Dow Jones falls 0.03% in the day, quoting when writing about 41,839.
- The Nasdaq 100 wins 0.11% daily, led by PDD Holdings (PDD).
- The S&P 500 decoced 0.06% on Thursday, weighed by Enfase Energy (ENPH).
- Weekly applications for US unemployment subsidy are located in 227,000, below market projections.
- The preliminary PMIS of the United States Global shed solid results in May.
The Dow Jones bounced from May 12 at 41,603, attracting buyers who promoted the index to a maximum of the day at 42,086.
The Dow Jones industrial average began operating in 41,867, while the Nasdaq 100 technological index began negotiations in 21,121. The S&P 500 opened in 5,851, taking up the upward perspective in tune with the main share rates.
UnitedHealth and Verizon lead losses in Dow Jones
The Dow Jones index loses 0.03% in the day, reaching minimum of May 12 in 41,603.
The titles of Unitedhealth (UNH) go back a 2.08 daily, falling to May 16 at 292.50, spinning two consecutive sessions down.
In the same tonic, the Verizon (VZ) values lose 1.42% today, reaching May 15 at 43.07 $.
The Dow Jones falls 11 points, signing its third consecutive day with losses, oscillating within the operational range of the previous session in 41,839.
MARVELL TECHNOLOGIES AND PDD HOLDINGS drive Nasdaq 100 to profit zone
The Nasdaq 100 technological index rises 0.15% daily, finding buyers from May 13 at 20,973.
The business group focused on electronic commerce, PDD Holdings (PDD) rises 3.10% daily, visiting May 14 in 120.00 $, cutting with two consecutive days down.
In the same tonic, Marvel Technology (MRVL) titles advance 2.89% on Thursday, reaching maximums not seen since May 19 at $ 62.86, finishing with a streak of five consecutive sessions with losses.
In this context, the Nasdaq 100 rebounds 23 points, consolidating within the range of the previous session in 21,111.
The S&P 500 extends its losing streak lame by Enfase Energy
According to the United States Department of Labor, the weekly applications for unemployment were located at 227,000 in the week that ended on May 17. This figure is below the estimated 230,000 and 229,000 reached in the previous week.
The preliminary PMI manufacturing of the US S&P global registered an increase to 52.3 points from the estimated 50.1, exceeding 50.2 reached in April. At the same time, the PMI of Services was located at 52.3 points, improving the previous and planned 50.8. The integrated PMI rose to 52.1 points in May compared to 50.6 observed in April.
Despite these solid data, the S&P 500 closed marginally downward, falling 3 points in the day, consolidating within the operating range of May 21 in 5,838. Enfase Energy (ENPH) values presented a 19.63% drop on Thursday, reaching April 27, 2020 in 37.59 $.
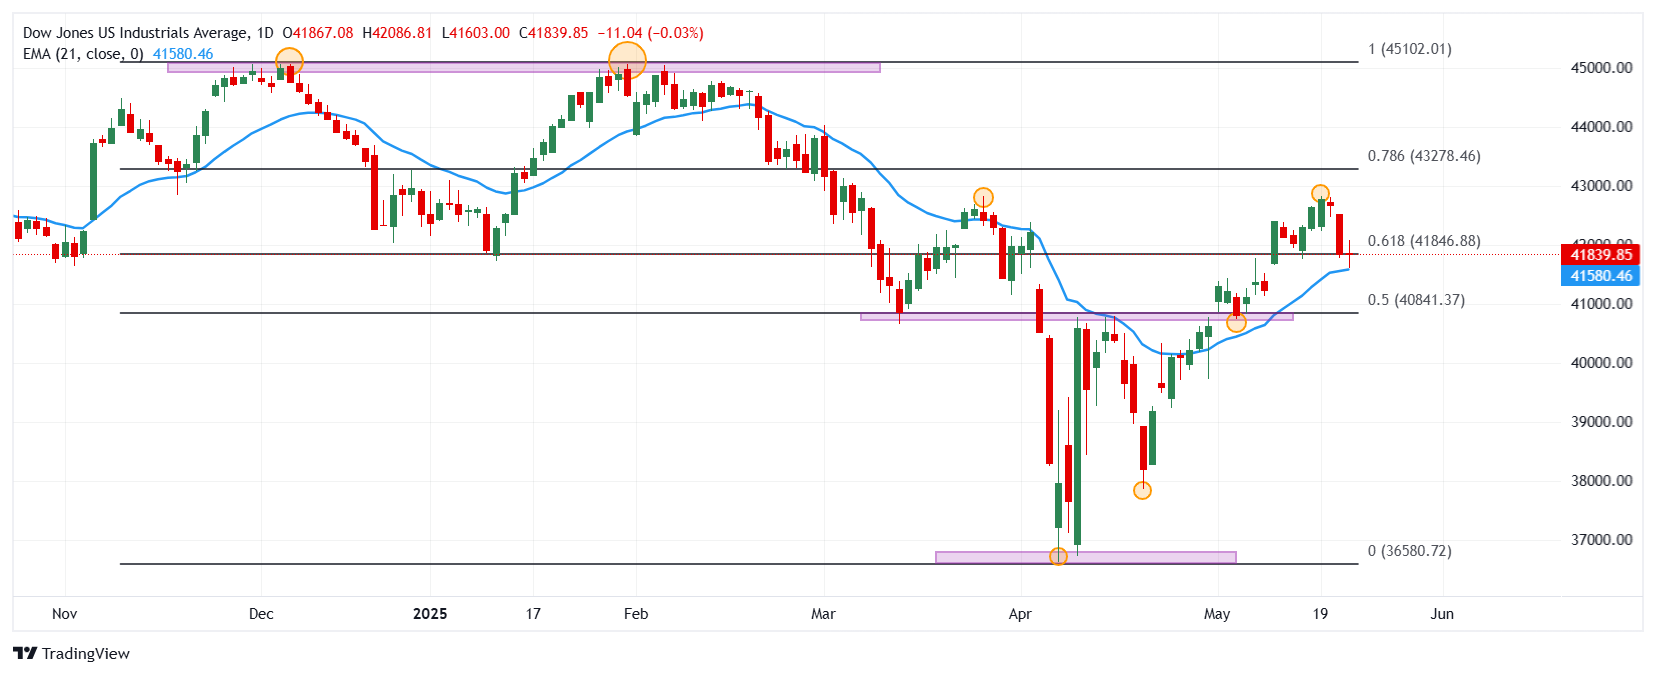
Technical Analysis of Dow Jones
The Dow Jones formed a short -term resistance given by the maximum of May 19 in 42,832. The next Calve resistance is located at 45,068, a pivot point of January 31. Down, the closest support is in 40,747, minimum of May 6, in convergence with the 50% fibonacci setback.
Dow Jones daily graphics
Dow Jones Faqs
The Dow Jones Industrial Avenge, one of the oldest stock market indexes in the world, consists of the 30 most negotiated values in the United States. The index is weighted by the price instead of capitalization. It is calculated by adding the prices of the values that compose it and dividing them by a factor, currently 0.152. The index was founded by Charles Dow, also founder of the Wall Street Journal. In recent years it has been criticized for not being sufficiently representative, since it only follows 30 companies, unlike broader rates such as S&P 500.
There are many factors that promote the Dow Jones Industrial Average (DJIA) index. The main one is the added performance of the companies that compose it, revealed in the quarterly reports of business benefits. The American and world macroeconomic data also contribute, since they influence investor confidence. The level of interest rates, set by the Federal Reserve (FED), also influences the DJia, since it affects the cost of credit, on which many companies depend largely. Therefore, inflation can be a determining factor, as well as other parameters that influence the decisions of the Federal Reserve.
Dow’s theory is a method to identify the main trend of the stock market developed by Charles Dow. A key step is to compare the direction of the Dow Jones Industrial Avenge (DJIA) and the Dow Jones Transportation Average (DJTA) and just follow the trends in which both move in the same direction. The volume is a confirmation criterion. The theory uses elements of maximum and minimum analysis. Dow’s theory raises three phases of the trend: accumulation, when intelligent money begins to buy or sell; Public participation, when the general public joins the trend; and distribution, when intelligent money abandons the trend.
There are several ways to operate with the DJ. One of them is to use ETF that allow investors to negotiate the DJ as a single value, instead of having to buy shares of the 30 companies that compose it. An outstanding example is the SPDR Dow Jones Industrial Avenge ETF (day). Future contracts on the DJ allow the specular operators about the future value of the index and the options provide the right, but not the obligation, to buy or sell the index at a predetermined price in the future. Investment funds allow investors to buy a part of a diversified portfolio of DJ values, which provides exposure to global index.
Source: Fx Street
I am Joshua Winder, a senior-level journalist and editor at World Stock Market. I specialize in covering news related to the stock market and economic trends. With more than 8 years of experience in this field, I have become an expert in financial reporting.


