
- The Dow Jones goes back 0.45% in the day, operating at the time of writing about 42,202.
- The Nasdaq 100 advances N 1.79% today, animated by Applovin Corporation (app).
- The S&P 500 rises 0.87%, driven by First Solar Inc. (FSLR).
- The United States consumer price index was 2.3% in April, improving analysts’ forecasts.
- The focus revolves to US retail sales and Jerome Powell’s speech for Thursday, May 15.
The Dow Jones marked a maximum of the day in 42,377, attracting aggressive vendors that dragged the index to a daily minimum in 42,124.
The Dow Jones industrial average began operating at 42,306, while the Nasdaq 100 technological index began negotiations in 20,860. The S&P 500 opened in 5,834, consolidating the medium -term bullish trend.
UnitedHealth drags Dow Jones to loss zone
The Dow Jones index falls 0.45% on Tuesday, currently quoting at 42,203.
The actions of United Health (UNH) collapse 16.17% in the day, reaching minimal not seen since November 3, 2020 in 316.20 $ after the resignation of its general director Andrew Witty.
In the same tune, Merck & Ccompany’s titles (MRK) lose 3.33% daily, staying within the operational range of the previous session at $ 77.72.
In this context, Dow Jones falls 203 points, oscillating within Monday’s range in 42,202.
Palantir Technologies and Applovin Corporation lead the profits at Nasdaq 100
The Nasdaq 100 technological index wins 1.79% daily, reaching maximums not seen since February 27 at 21,254.
Palantir Technologies (PLTR) values shoot 9.70% today establishing a new historical maximum at $ 130.08, signing its second consecutive upward day.
Following the bullish perspective, Applovin Corporation titles (app) rebound 8.72% daily, reaching maximum of February 25 at $ 830.70.
The Nasdaq 100 goes up 377 points on the second day of the week, operating at the time of writing about 21,240.
The S&P 500 extends its profits after the decrease in the United States CPI
According to information provided by the US Labor Statistics Office, the Consumer Price Index stood at 2.3% in April, below the previous 2.4%.
In this sense, the S&P 500 rises 50 points today, winning 0.87% and reaching maximums not seen since March 3 in 5,897.
The titles of First Solar Inc. (FSLR) rebound a 22.50% daily, reaching maximums of January 17 in 192.82 $, signing its fifth consecutive day with profits.
The attention of the operators will now be placed on the retail sales of the United States, as well as in the speech of the president of the Federal Reserve, Jerome Powell, scheduled for Thursday, May 15.
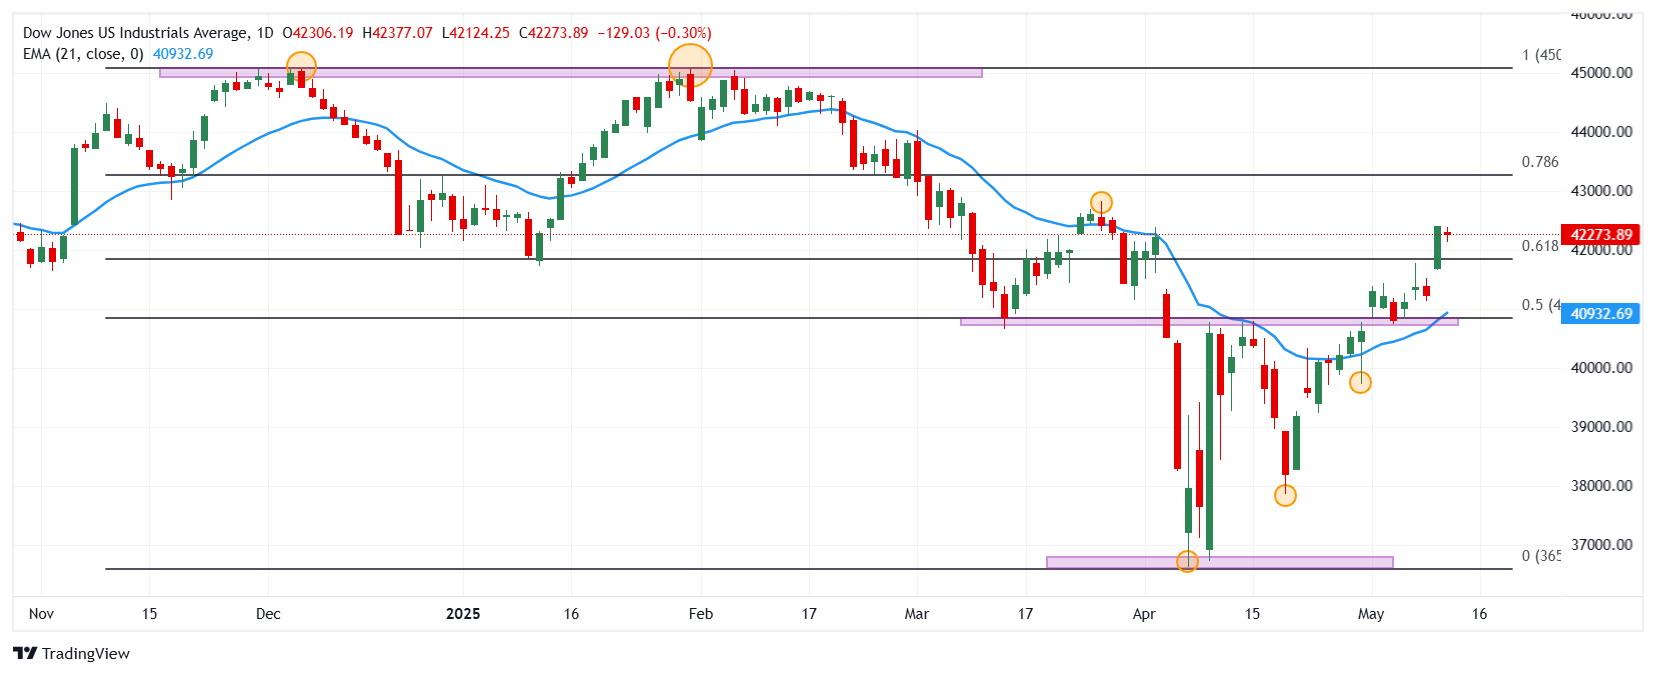
Technical Analysis of Dow Jones
The Dow Jones formed a short -term support given by the minimum of April 30 at 39,731. The following important support is 36.614, minimum of April 7. To the north, the closest resistance is located at 42,820, pivot point of March 26.
Dow Jones daily graphics
Dow Jones Faqs
The Dow Jones Industrial Avenge, one of the oldest stock market indexes in the world, consists of the 30 most negotiated values in the United States. The index is weighted by the price instead of capitalization. It is calculated by adding the prices of the values that compose it and dividing them by a factor, currently 0.152. The index was founded by Charles Dow, also founder of the Wall Street Journal. In recent years it has been criticized for not being sufficiently representative, since it only follows 30 companies, unlike broader rates such as S&P 500.
There are many factors that promote the Dow Jones Industrial Average (DJIA) index. The main one is the added performance of the companies that compose it, revealed in the quarterly reports of business benefits. The American and world macroeconomic data also contribute, since they influence investor confidence. The level of interest rates, set by the Federal Reserve (FED), also influences the DJia, since it affects the cost of credit, on which many companies depend largely. Therefore, inflation can be a determining factor, as well as other parameters that influence the decisions of the Federal Reserve.
Dow’s theory is a method to identify the main trend of the stock market developed by Charles Dow. A key step is to compare the direction of the Dow Jones Industrial Avenge (DJIA) and the Dow Jones Transportation Average (DJTA) and just follow the trends in which both move in the same direction. The volume is a confirmation criterion. The theory uses elements of maximum and minimum analysis. Dow’s theory raises three phases of the trend: accumulation, when intelligent money begins to buy or sell; Public participation, when the general public joins the trend; and distribution, when intelligent money abandons the trend.
There are several ways to operate with the DJ. One of them is to use ETF that allow investors to negotiate the DJ as a single value, instead of having to buy shares of the 30 companies that compose it. An outstanding example is the SPDR Dow Jones Industrial Avenge ETF (day). Future contracts on the DJ allow the specular operators about the future value of the index and the options provide the right, but not the obligation, to buy or sell the index at a predetermined price in the future. Investment funds allow investors to buy a part of a diversified portfolio of DJ values, which provides exposure to global index.
Source: Fx Street
I am Joshua Winder, a senior-level journalist and editor at World Stock Market. I specialize in covering news related to the stock market and economic trends. With more than 8 years of experience in this field, I have become an expert in financial reporting.


