
- The Dow Jones loses 0.18% daily, currently quoting about 39. 485.
- The Nasdaq 100 loses 0.05% on Friday, dragged by APPLOVIN CORPORATION (APP).
- The S&P 500 decoced 0.19% in the day, staying within the operational range of the previous session.
- The United States production price index is 2.7% in March, below the 3.3% expected by the consensus of analysts.
- The feeling of the consumer of the University of Michigan contracts 50.8 points in April, worsening market expectations.
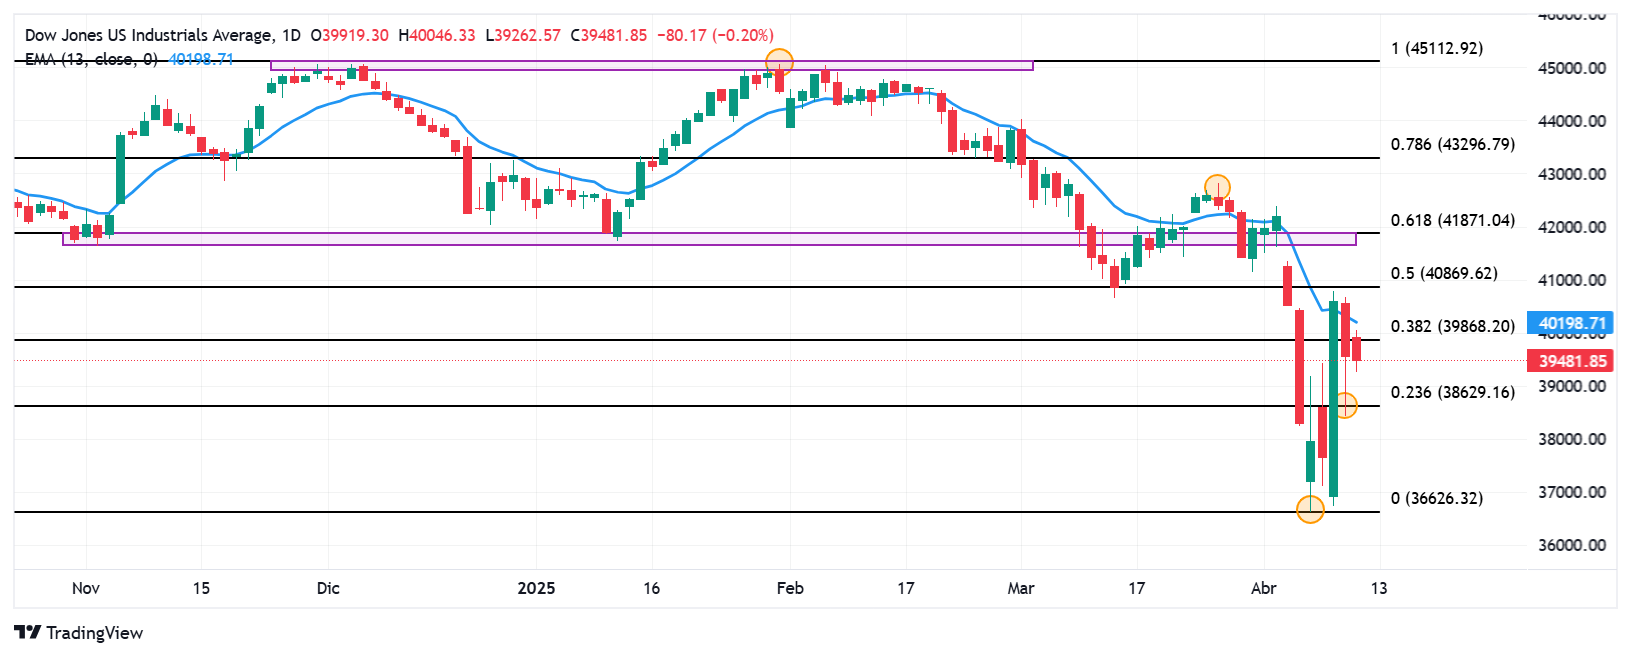
The Dow Jones established a minimum of the day at 39,262, finding buyers who promoted the index to a daily maximum in 40,046.
The Dow Jones industrial average began negotiations at 39,919, while the Nasdaq 100 technological index began operating in 18,492. The S&P 500 opened in 5.315, maintaining the short -term bass perspective.
Salesforce and Nike drag Dow Jones to a negative zone
The Dow Jones index falls 0.18% today, currently operating at 39,485.
Salesforce (CRM) titles go back 2.63% daily, reaching minimum of April 9 at 247,80 $, signing its second consecutive day down.
In the same tune, Nike (NKE) values have a loss of 2.52% on Friday, consolidating within the operational range of the previous session at 53.04 $.
In this context, Dow Jones loses 522 points a day, extending the losses of yesterday, in the midst of tariff concerns and fears of inflation in the short term.
The Nasdaq 100 is quoted downwards by Applovin Corporation and Texas Instruments
The Nasdaq 100 technological index loses 0.05% in the day, reaching a daily minimum in 18,652.
APPLOVIN CORPORATION (APP) shares sink 8.49% daily, extending the losses suffered yesterday and reaching a minimum of the day at $ 239.00.
Following the bassist perspective, Texas Instruments (TXN) titles collapse 8.18% today, reaching minimal not seen since October 30, 2023 at $ 139.95.
The Nasdaq 100 has established itself in a lateral range established by the minimum of April 7 in 16,347 and the maximum of April 9 in 19,226, currently operating over 18,295.
The S&P 500 operates with marginal profits after the US IPP and statements of the Fed members
According to information presented by the US Labor Statistics Office, the production price index increased 2.7% annualized in March, below the 3.3% expected and 3.2% observed in February.
Similarly, the feeling of the consumer of the University of Michigan presented a decrease to 50.8 points in April, disappointing the market projections of 54.5 points, standing below the 57 registered in March.
On the other hand, the president of the Federal Reserve of St. Louis, Alberto Musalem, acknowledged that the downward risks for growth persist, highlighting the high economic uncertainty in the short term. In the same tonic, the president of the Federal Reserve of Minneapolis, Neel Kashkari, said that the effect of tariffs suggests that inflation will increase again, placing the monetary authority in a complicated position.
In this context, the S&P 500 goes back 0.19%, consolidating within the operational range of the previous session in 5,255, signing its second consecutive day down.
Technical Analysis of Dow Jones
The Dow Jones established a short -term resistance given by the maximum of March 26 in 42,820. The next key resistance is observed at 45,068, maximum of January 31. To the south, the key support zone is located at 36,614, a pivot point of April 7.
Dow Jones daily graphics
Dow Jones Faqs
The Dow Jones Industrial Avenge, one of the oldest stock market indexes in the world, consists of the 30 most negotiated values in the United States. The index is weighted by the price instead of capitalization. It is calculated by adding the prices of the values that compose it and dividing them by a factor, currently 0.152. The index was founded by Charles Dow, also founder of the Wall Street Journal. In recent years it has been criticized for not being sufficiently representative, since it only follows 30 companies, unlike broader rates such as S&P 500.
There are many factors that promote the Dow Jones Industrial Average (DJIA) index. The main one is the added performance of the companies that compose it, revealed in the quarterly reports of business benefits. The American and world macroeconomic data also contribute, since they influence investor confidence. The level of interest rates, set by the Federal Reserve (FED), also influences the DJia, since it affects the cost of credit, on which many companies depend largely. Therefore, inflation can be a determining factor, as well as other parameters that influence the decisions of the Federal Reserve.
Dow’s theory is a method to identify the main trend of the stock market developed by Charles Dow. A key step is to compare the direction of the Dow Jones Industrial Avenge (DJIA) and the Dow Jones Transportation Average (DJTA) and just follow the trends in which both move in the same direction. The volume is a confirmation criterion. The theory uses elements of maximum and minimum analysis. Dow’s theory raises three phases of the trend: accumulation, when intelligent money begins to buy or sell; Public participation, when the general public joins the trend; and distribution, when intelligent money abandons the trend.
There are several ways to operate with the DJ. One of them is to use ETF that allow investors to negotiate the DJ as a single value, instead of having to buy shares of the 30 companies that compose it. An outstanding example is the SPDR Dow Jones Industrial Avenge ETF (day). Future contracts on the DJ allow the specular operators about the future value of the index and the options provide the right, but not the obligation, to buy or sell the index at a predetermined price in the future. Investment funds allow investors to buy a part of a diversified portfolio of DJ values, which provides exposure to global index.
Source: Fx Street
I am Joshua Winder, a senior-level journalist and editor at World Stock Market. I specialize in covering news related to the stock market and economic trends. With more than 8 years of experience in this field, I have become an expert in financial reporting.


