
- The Dow Jones rises 0.81% in the day, visiting maximums of February 7 in 44,877.
- The Nasdaq 100 wins 0.46% today, registering a new historical maximum in 22,782.
- The S&P 500 advances 0.76% daily, establishing a new historical maximum in 6,282.
- The non -agricultural payrolls of the United States increase to 147,000, located above market estimates.
- Weekly applications of unemployment subsidy decrease to 233,000, below the 240,000 observed in the previous week.
The Dow Jones established a minimum of the day at 44,372, finding buyers who took the index to maximum of February 7 in 44,877.
The Dow Jones industrial average opened at 44,524, while the Nasdaq 100 technological index began operating at 22,623. The S&P 500 started the day in 6,228, registering a new historical maximum in 6,282.
The Dow Jones reaches almost 5 months old promoted by The Travelers Companies and Boeing
The Dow Jones index presents a gain of 0.81% daily, currently quoting at 44,830.
The titles of The Travelers Companies (TRV) advance 2.64% daily, consolidating within the operational range of the previous session at 264.13 $, ending with two consecutive days down.
In the same tonic, Boeing (BA) shares earn 1.83% today, the values of Unitedhealth (UNH) go back in 5.70% today, reaching maximums of the 10 in June in June at 217.68 $, signing its third consecutive session with profits.
The Dow Jones goes up 358 points, reaching maximums of February 7 in 44,877.
The Nasdaq 100 establishes a new historical maximum driven by Datag and Cadence Design Systems
The Nasdaq 100 technological index advances 0.46% in the day, establishing a new historical maximum in 22,782.
The titles of Cadence Design Systems (CDNS) rebound 5.10% today, establishing a new historical maximum in 330.09 $, spinning four consecutive days on the field.
Following the upward perspective, the shares of Datag (DDOG) shoot 14.92% today, visiting maximums of December 18, 2024 in 156.53 $.
The Nasdaq 100 wins 103 points, waiting for the moment of writing about 22,739.
The S&P 500 brand new historical maximums animated by First Solar
According to information from the Offer Administration Institute (ISM), the PMI of Services rose to 50.8 points in June, exceeding the estimates of the 50.5 points and 49.9 observed the previous month.
The non -agricultural payrolls of the United States increased to 147,000 in June, standing above the 110,000 planned and the 144,000 observed in May.
The weekly unemployment subsidy requests fell to 233,000 in the week that ended on June 28, located below the 240,000 observed in the previous week.
In another front, the First Solar Titles (FSLR) shoot 8.51% today, reaching May 15 in 189.50 $, spinning two consecutive sessions upwards.
The S&P 500 advances 47 points on Thursday, reaching new historical maximums in 6,282.
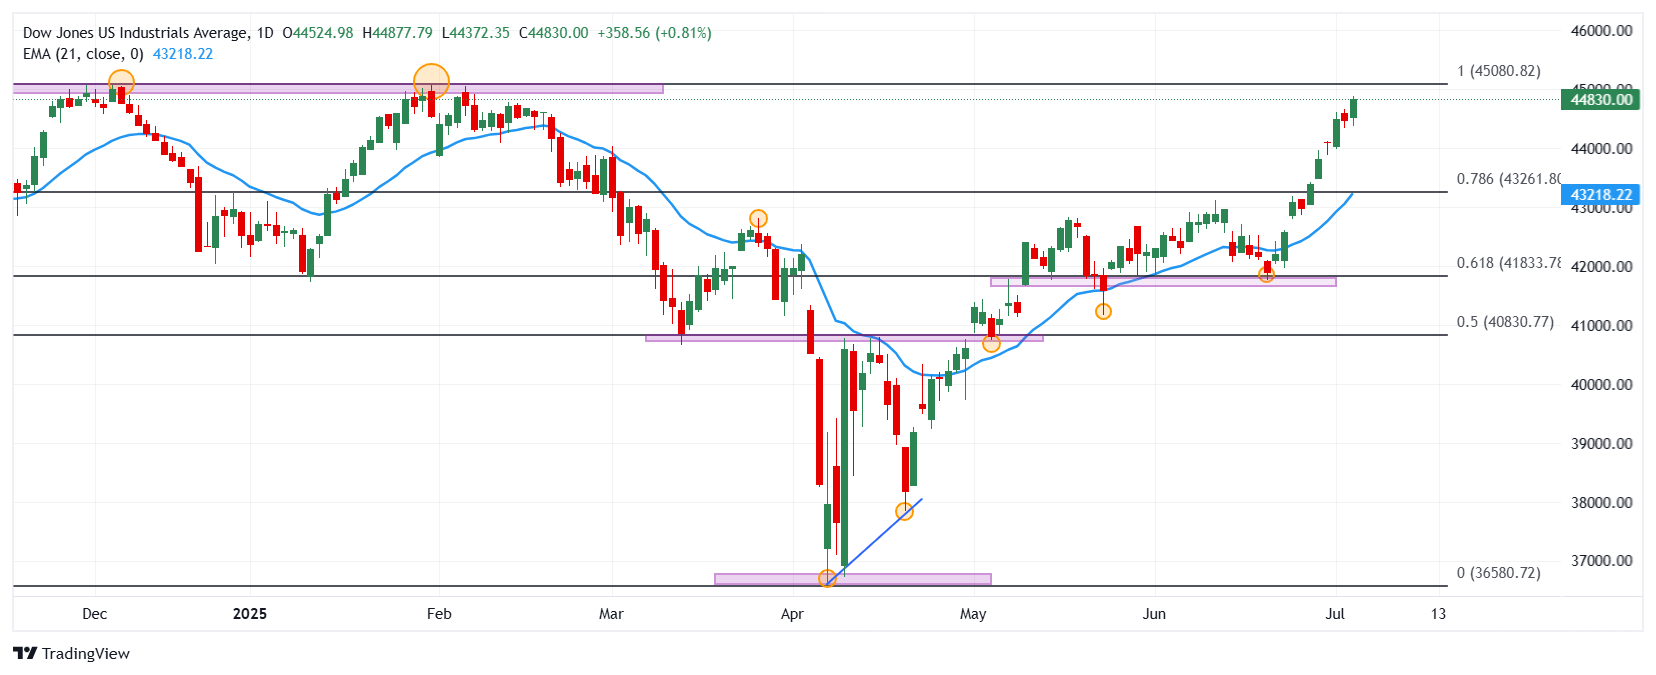
Technical Analysis of Dow Jones
The Dow Jones formed a short -term support given by the minimum of June 19 in 41,971. The following key support is located in 40,747, a pivot point of May 6, in convergence with the 50% fibonacci setback. Upwards, the important resistance is 45,068, maximum of January 31.
Dow Jones daily graphics
Dow Jones – Frequently Questions
The Dow Jones Industrial Avenge, one of the oldest stock market indexes in the world, consists of the 30 most negotiated values in the United States. The index is weighted by the price instead of capitalization. It is calculated by adding the prices of the values that compose it and dividing them by a factor, currently 0.152. The index was founded by Charles Dow, also founder of the Wall Street Journal. In recent years it has been criticized for not being sufficiently representative, since it only follows 30 companies, unlike broader rates such as S&P 500.
There are many factors that promote the Dow Jones Industrial Average (DJIA) index. The main one is the added performance of the companies that compose it, revealed in the quarterly reports of business benefits. The American and world macroeconomic data also contribute, since they influence investor confidence. The level of interest rates, set by the Federal Reserve (FED), also influences the DJia, since it affects the cost of credit, on which many companies depend largely. Therefore, inflation can be a determining factor, as well as other parameters that influence the decisions of the Federal Reserve.
Dow’s theory is a method to identify the main trend of the stock market developed by Charles Dow. A key step is to compare the direction of the Dow Jones Industrial Avenge (DJIA) and the Dow Jones Transportation Average (DJTA) and just follow the trends in which both move in the same direction. The volume is a confirmation criterion. The theory uses elements of maximum and minimum analysis. Dow’s theory raises three phases of the trend: accumulation, when intelligent money begins to buy or sell; Public participation, when the general public joins the trend; and distribution, when intelligent money abandons the trend.
There are several ways to operate with the DJ. One of them is to use ETF that allow investors to negotiate the DJ as a single value, instead of having to buy shares of the 30 companies that compose it. An outstanding example is the SPDR Dow Jones Industrial Avenge ETF (day). Future contracts on the DJ allow the specular operators about the future value of the index and the options provide the right, but not the obligation, to buy or sell the index at a predetermined price in the future. Investment funds allow investors to buy a part of a diversified portfolio of DJ values, which provides exposure to global index.
Source: Fx Street
I am Joshua Winder, a senior-level journalist and editor at World Stock Market. I specialize in covering news related to the stock market and economic trends. With more than 8 years of experience in this field, I have become an expert in financial reporting.


