
- USA and China agree to a reduction of 90 -day tariffs; The US cuts to 30%, China at 10%, relieving the fears of global recession.
- The dollar triggers the optimism of the agreement; DXY rises more than 1% to its highest level since April 10.
- The United Kingdom merchants prepare for a week occupied with employment, GDP and manufacturing data while BOE officials adopt a cautious tone.
The sterling pound collapsed more than 0.71% or 90 pips on Monday, after the weekend developments that promoted the US dollar. The news about the de -escalation of the commercial war between the US and China weighed on the pound, which collapsed from around 1,3298. At the time of writing, the GBP/USD quotes at 1,3207.
GBP/USD more than 0.71% collapse after the unwinding of tariff
The US and China agreed to reduce tariffs, with the US reducing their 115% to 30% taxes on Chinese goods, while Beijing cut their 10% tariffs on US imports. The agreement is a 90 -day pause, effective as of May 14.
Investors welcomed the news while Wall Street opened in green amid the speculation that an agreement between Washington and Beijing could prevent the global economy from sliding towards recession. Meanwhile, merchants are attentive to the publication of US Consumer Price Index (CPI) data together with inflation data in the producer front and retail sales.
Meanwhile, the US dollar index (DXY), which tracks the performance of the US dollar compared to six other main currencies, has risen more than 1% to 101.54, its highest level from April 10.
The United Kingdom’s economic agenda will have employment data on Tuesday, followed by GDP data and manufacturing on Thursday. Meanwhile, the officials of the Bank of England (BOE) are hoarding headlines.
Megan Green of the Bank of England and Vice Governor Clare Lombardelli expressed that inflation is moving in the right direction. However, Lombardelli warned that he remains cautious and will expect evidence of a deceleration.
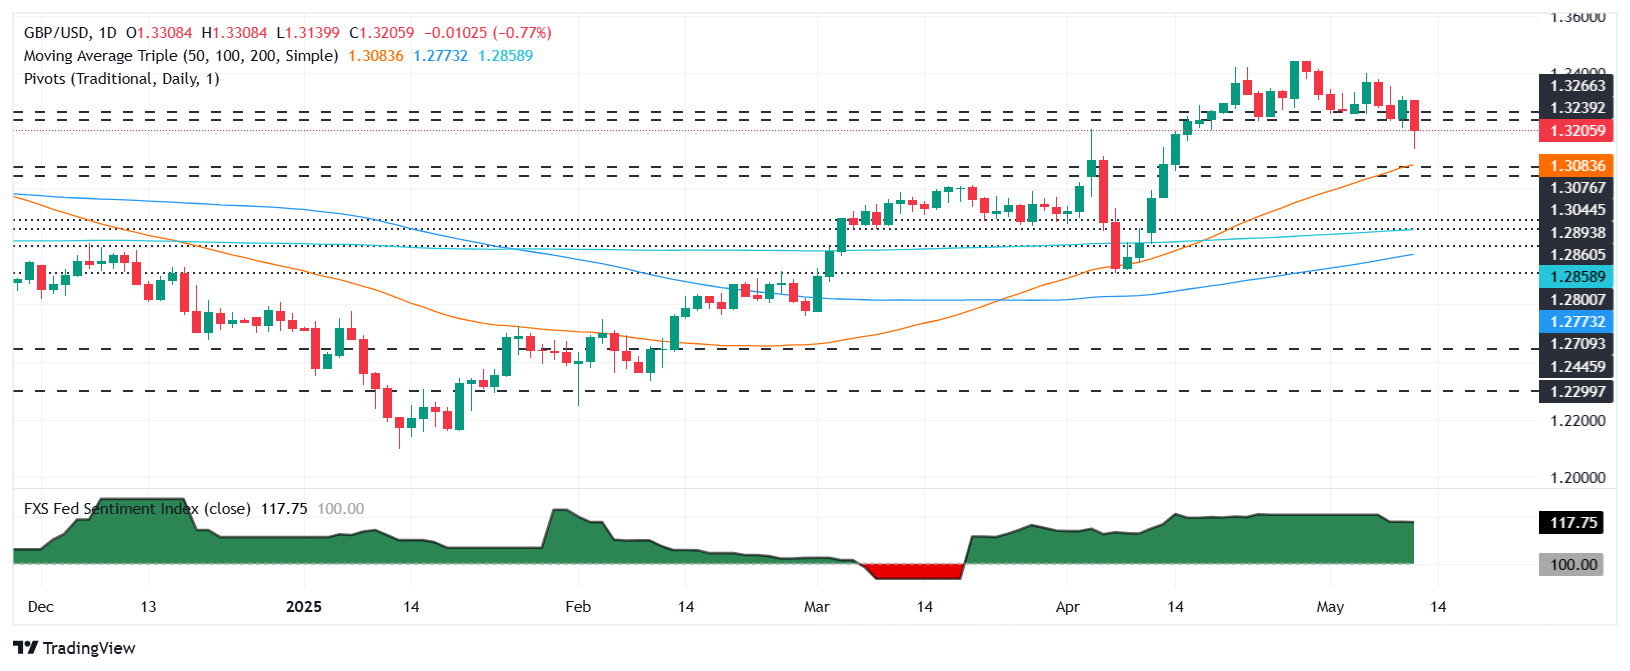
GBP/USD price graph: Technical perspective
The GBP/USD rally stopped before the US optimistic news, which sent to the simple mobile average (SMA) of 50 days of 1,3080, but the vendors lacked the force to overcome 1,3200 and the subsequent support levels in 1,3150 and the figure of 1,3100.
A daily closure below the minimum of May 9, 1,3211 could pave the way for a negative week for the currency, but the catalysts could keep the GBP/USD within the current level if the data keep the status quo.
On the other hand, if the GBP/USD rises above 1,3250, the next resistance level would be the simple mobile (SMA) of 20 days in 1,3308. A rupture of this last will expose the maximum of May 6 in 1,3402.
LIBRA ESTERLINA PRICE TODAY
The lower table shows the percentage of pounding sterling (GBP) compared to the main currencies today. Libra sterling was the strongest currency against the Japanese and in Japanese.
| USD | EUR | GBP | JPY | CAD | Aud | NZD | CHF | |
|---|---|---|---|---|---|---|---|---|
| USD | 1.19% | 0.77% | 1.26% | 0.71% | 0.62% | 0.97% | 0.99% | |
| EUR | -1.19% | -0.29% | 0.63% | 0.00% | 0.06% | 0.26% | 0.26% | |
| GBP | -0.77% | 0.29% | 1.10% | 0.29% | 0.36% | 0.47% | 0.55% | |
| JPY | -1.26% | -0.63% | -1.10% | -0.57% | -1.27% | -1.15% | -0.53% | |
| CAD | -0.71% | -0.00% | -0.29% | 0.57% | 0.18% | 0.25% | 0.25% | |
| Aud | -0.62% | -0.06% | -0.36% | 1.27% | -0.18% | 0.10% | 0.17% | |
| NZD | -0.97% | -0.26% | -0.47% | 1.15% | -0.25% | -0.10% | -0.02% | |
| CHF | -0.99% | -0.26% | -0.55% | 0.53% | -0.25% | -0.17% | 0.02% |
The heat map shows the percentage changes of the main currencies. The base currency is selected from the left column, while the contribution currency is selected in the upper row. For example, if you choose the sterling pound from the left column and move along the horizontal line to the US dollar, the percentage change shown in the box will represent the GBP (base)/USD (quotation).
Source: Fx Street
I am Joshua Winder, a senior-level journalist and editor at World Stock Market. I specialize in covering news related to the stock market and economic trends. With more than 8 years of experience in this field, I have become an expert in financial reporting.


