“Curtain from dark clouds”
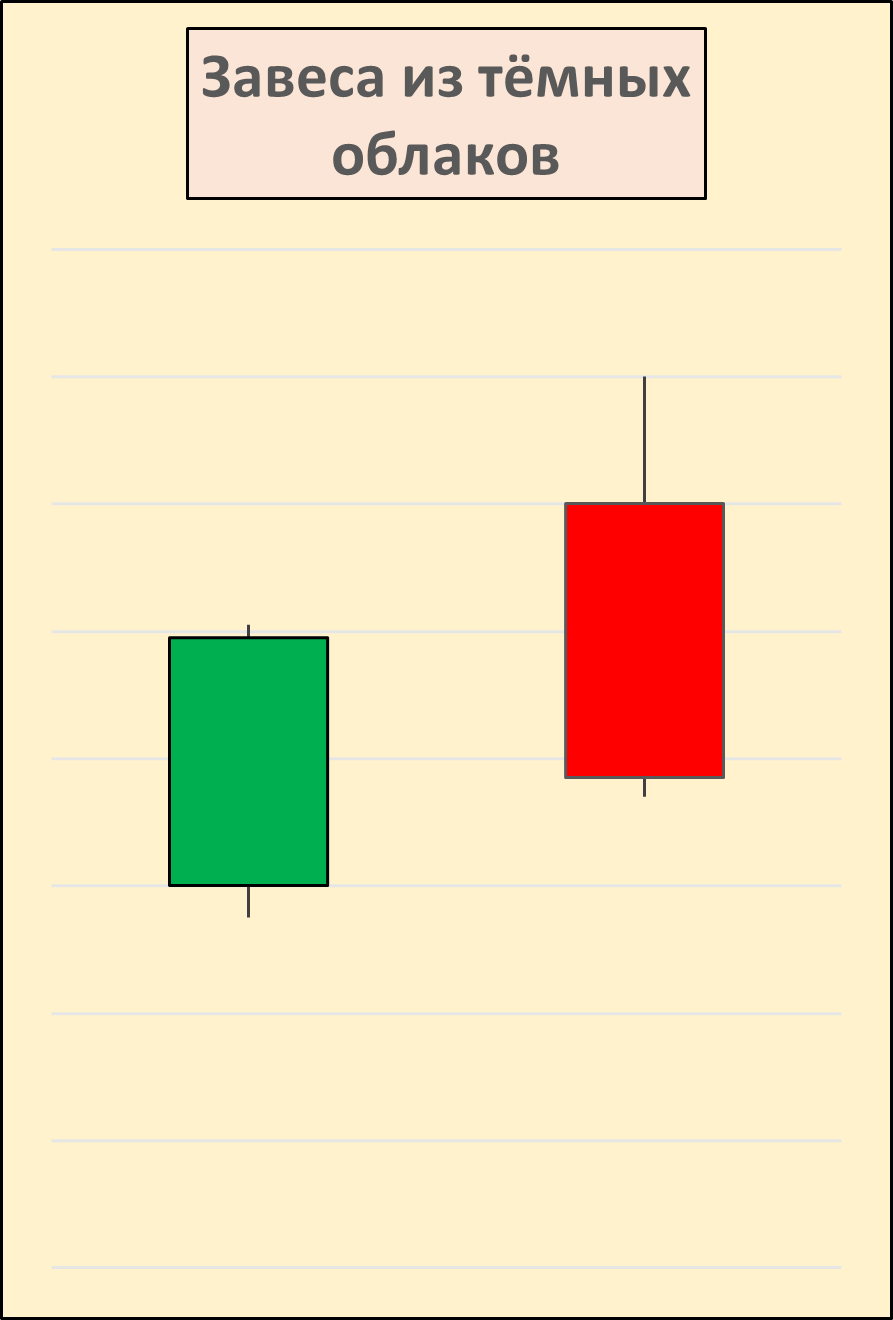
“Dark Cloud Cover” is a “Dark Cloud Cover”) is a figure that occurs in the graphics of Japanese candles after the rising trend. In a classic form, it is a combination of two candles: the first green (white), and the second red (black). The opening price of the latter is higher than the previous maximum, and the closing price goes beyond the middle of its body:
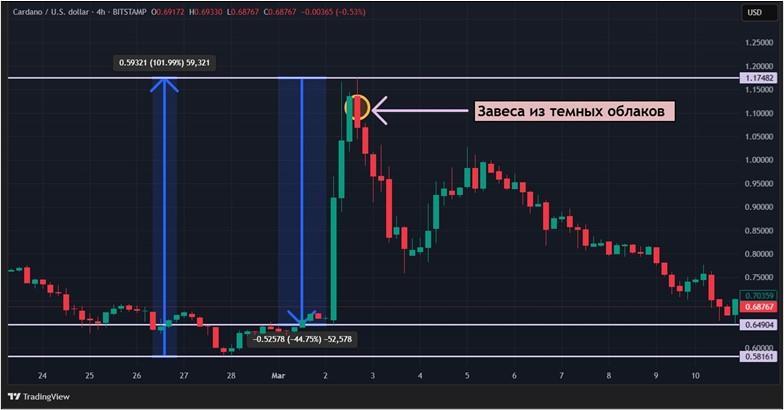
Nevertheless, with real trading, the theoretical model is not often found – there is much more chance of meeting its varieties. One of the examples arose recently, on March 2, on a four -hour Cardano schedule. In five days, from February 27, cryptocurrency increased by 102%. The trend was replaced after a “curtain” arose on the graph. It was not classic, since the opening price of the second candle did not exceed the maximum first. However, a 44%correction that arose after the pattern did not interfere. The figure can be observed on the graph below – it is indicated by a yellow circle.
Source: TradingView.com
A pattern can indicate not only a reduction in the cost of a cryptoactive, but also the formation of a resistance level. Most of the time of cryptocurrency, like any other tools, is carried out in the lateral movement. It is not surprising that the “curtain of dark clouds”, being a bear signal, can act as a starting point of attenuation of the bull trend.
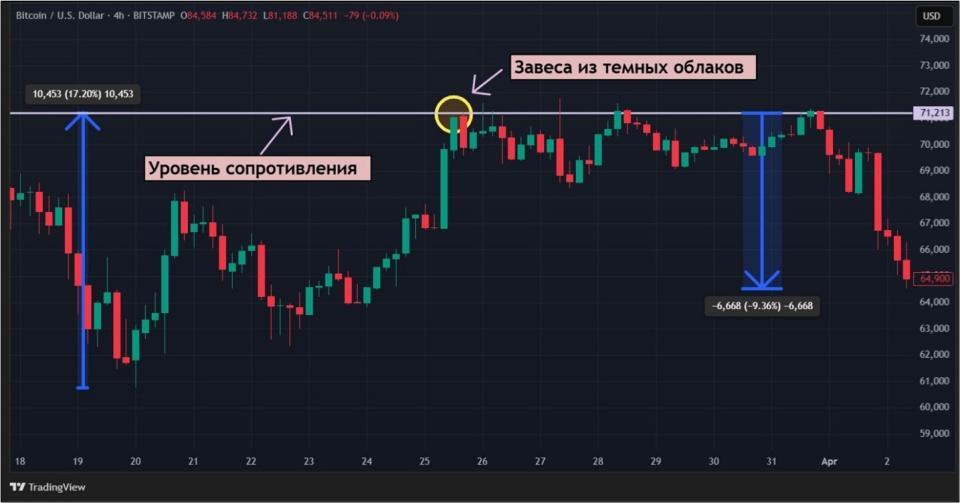
So, from March 20 to March 25, Bitcoin grew by more than 17%, then the rise was stopped by a “curtain”. However, there was no sharp decline. For another six days, the price stagnated around the price range set by the “veil”. Several times the BTC quotes even exceeded the maximum of the candle figure, but it was not possible to gain a foothold above. This became evidence of the formation of a powerful level of resistance. As a result, by April 2, Bitcoin fell by 9.36%, confirming the bear’s nature of the candle model. This picture can be observed in the figure below – the “curtain” is indicated by a yellow circle.
Source: TradingView.com
“Generative in the clouds”
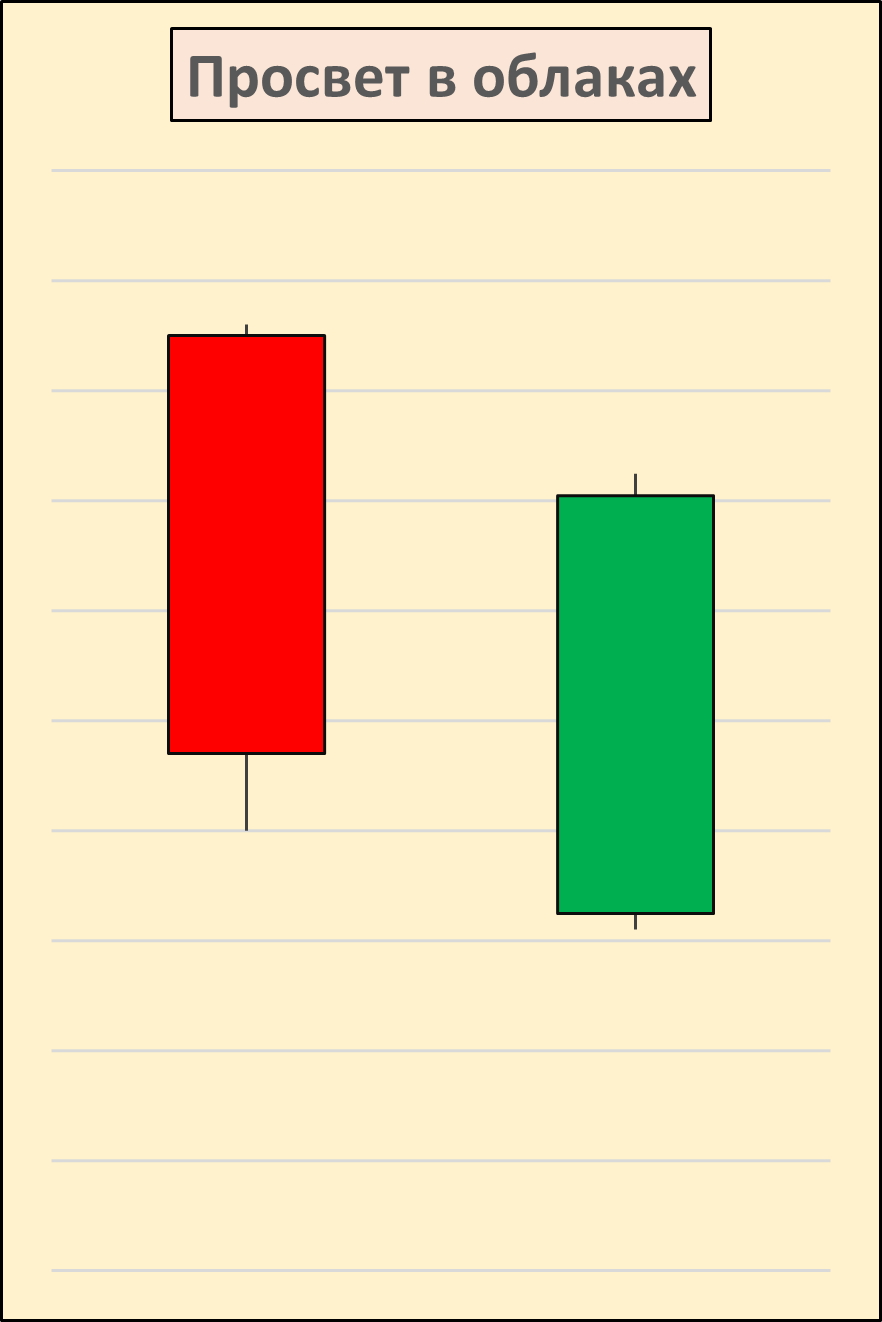
“Line in the clouds” (“Piercing Pattern”) is a figure that occurs in the graph of Japanese candles after a downward movement. Like the “curtain of dark clouds”, it consists of two candles: the first red (black), and the second green (white). The opening price of the second is lower than the minimum of the previous one, and the closing price is above its middle. However, in practice, the ideal version of the “lumen in the clouds” is extremely rare – in most cases there will be small discrepancies. Classic variation can be observed from the figure below.
“Generative in the clouds” is a bull model. It is more rare in comparison with a “curtain of dark clouds.” This is due to the fact that the fear of losing savings most often exceeds the thirst for profit.
So, in December 2024, a decrease was outlined on the Cardano schedule – on the 20th on the 30th, the cost of the ADA sank by more than 16%. The fall was suspended by the “clearance in the clouds”, which formed on a four -hour schedule. The model was not classic, since the opening price of the second candle was lower than the closing price of the previous day, but not its minimum. Nevertheless, such a “flaw” pattern did not prevent Cardano over the next four days to grow by 35%, confirming the bull’s “clearance”. The incident can be observed on the graph below.
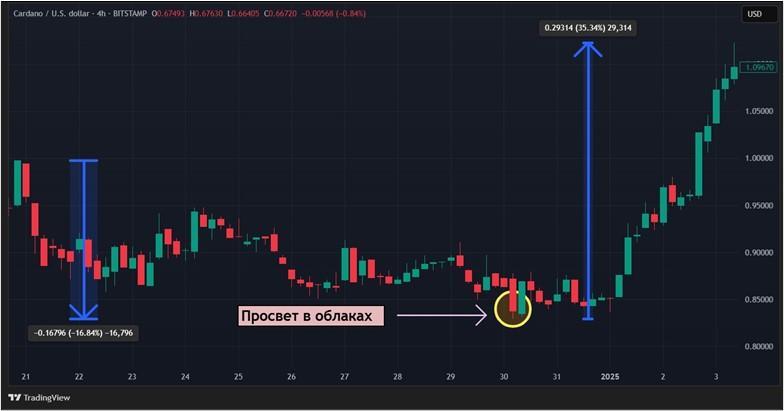
Source: TradingView.com
Pattern also forms quite strong support levels. For example, on December 20, 2024, on a four -hour Avalanche schedule, an “lumen in the clouds” was formed about $ 33.53, after which the drop in the cryptocurrency ceased. Interestingly, on January 13, the price came to this level again. Another “clearance” confirmed the support level, and Avalanche went on to growth. The current situation can be observed on the graph below.
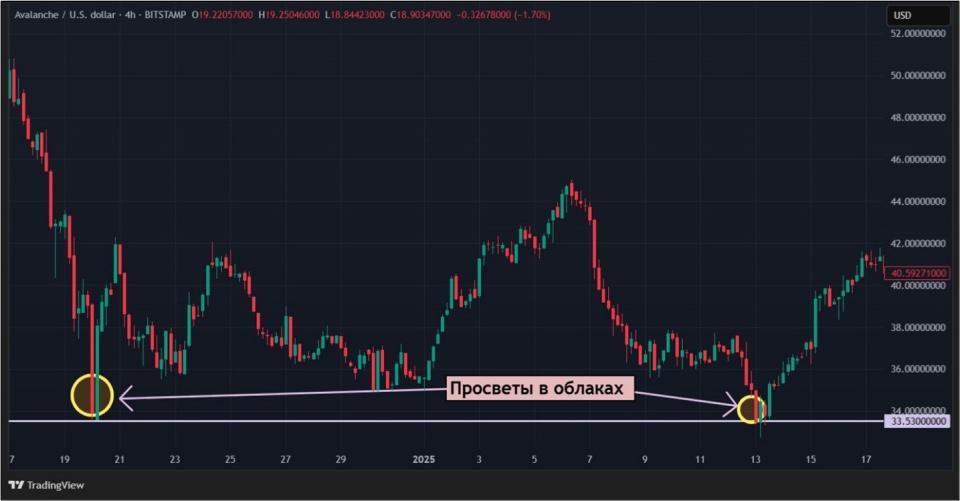
Source: TradingView.com
Advantages and disadvantages of models
Any methods of technical analysis have their advantages and disadvantages. There are also “curtains from dark clouds” and “lumen in the clouds”.
As noted earlier, classic models are rare. This suggests that the analysis of candle graphs should be flexible enough. Traiders will differently approach the interpretation of emerging figures: some will wait for a classic model, others are enough patterns with small deviations. In the second case, you need a certain experience so as not to incur losses.
It must be remembered that Japanese candles are not a strict set of rules, but only an indication of the right direction. Also, do not neglect the methods of Western technical analysis. For example, the same “lumen in the clouds” combines well with 50% corrections. If these two signals coincide, they will only confirm each other. In addition, to limit losses, it is worthwhile to set the feet, since any interpretation of the model can be incorrect.
Conclusion
“Bades of dark clouds” and “lumen in the clouds” are reversal models that are found on the graphs of Japanese candles. The first serves as an omen of the change of bull trend, and the second is a bear. The “curtain from dark clouds” often occurs on cryptocurrency schedules than the “lumen in the clouds”.
This material and information in it is not an individual or other other investment recommendation. The view of the editorial office may not coincide with the opinions of analytical portals and experts.
Source: Bits
I am an experienced journalist, writer, and editor with a passion for finance and business news. I have been working in the journalism field for over 6 years, covering a variety of topics from finance to technology. As an author at World Stock Market, I specialize in finance business-related topics.


