
- The price of gold attracts new sellers in the middle of the renewed purchase of USD and the reduction of the expectations of cutting fees of the Fed.
- A generally positive risk tone is seen as another factor that undermines precious metal.
- The persistent uncertainties related to trade could limit losses for safe refuge merchandise.
The price of gold (Xau/USD) is maintained with modest intradic losses when entering the European session on Thursday, although it lacks bassist conviction and remains comfortably above the weekly minimum reached the previous day. The president of the USA, Donald Trump, denied the reports that he plans to say goodbye to the president of the Federal Reserve (Fed), Jerome Powell. Apart from this, the bets that the US Central Bank will delay the trimming of interest rates help the US dollar (USD) to reverse Wednesday’s setback from its highest level since June 23. This, together with a generally positive tone in variable rental markets, is considered to undermine precious metal.
That said, persistent uncertainties around Trump’s commercial policies and their impact on the global economy keep investors in tension. This could continue to offer some support for the price of safe shelter gold and make a monitoring before positioning for an extension of the night setback from a maximum of three weeks. Investors now expect the publication of US retail sales and the usual weekly data of initial unemployment applications. Apart from this, the Speeches of influential FOMC members should boost the demand of the USD and generate trading opportunities around the non -productive yellow metal.
Daily summary of market movements: the price of gold remains depressed in the middle of a stronger USD and a positive risk tone
- Investors were nervous on Wednesday, which caused a strong sale of the US dollar and pushed the price of safe refuge gold to a new maximum of several weeks amid reports that US president, Donald Trump, was looking to dismiss the president of the Federal Reserve, Jerome Powell. However, market volatility decreased after Trump told journalists that it was unlikely to fire the head of the Central Bank.
- In the Economic Data Front, the US Production Price Index (IPP) did not meet market expectations and remained flat in June. This marked a remarkable slowdown in the price of goods sold by manufacturers. In addition, the comments of FOMC influential members suggest that the Fed will probably wait at least until September before resuming its cycle of feat cuts.
- Meanwhile, the president of the Fed in New York, John Williams, warned that the impact of commercial tariffs is modest so far, but will increase over time. Williams added that the economy is in a good place, the labor market is solid and the current moderately restrictive monetary policy is in the right place to allow those responsible for policies to monitor the economy before taking the next steps.
- In addition, the president of the Fed of Dallas, Lorie Logan, said that the Central Bank of the USA will probably need to keep interest rates for a while to ensure that inflation is kept low. Logan also pointed out that tariff increases seem prone to creating inflationary pressure, and June IPC data suggest that PCE inflation, which the Fed has as its objective that is at an annual rate of 2%, will increase.
- However, the operators are still valuing the possibility of 50 basic relief points by the Fed this year. This, together with the concerns about the possible economic repercussions of Trump’s erratic commercial policies, could support the precious metal of safe refuge. In fact, Trump notified last week to the leaders of 25 countries on new tariff rates that will enter into force on August 1.
- The US economic agenda on Thursday includes the publication of monthly retailers, the usual initial applications of unemployment subsidy and the manufacturing index of the Fed of Philadelphia. Apart from this, the comments of influential members of the FOMC will be analyzed in search of clues about the trajectory of fed rates cuts, which will boost the USD and provide some impulse to the XAU/USD torque.
It is more likely that the price of gold will find a good support and attract buyers near the area of 3,322-3.320 $
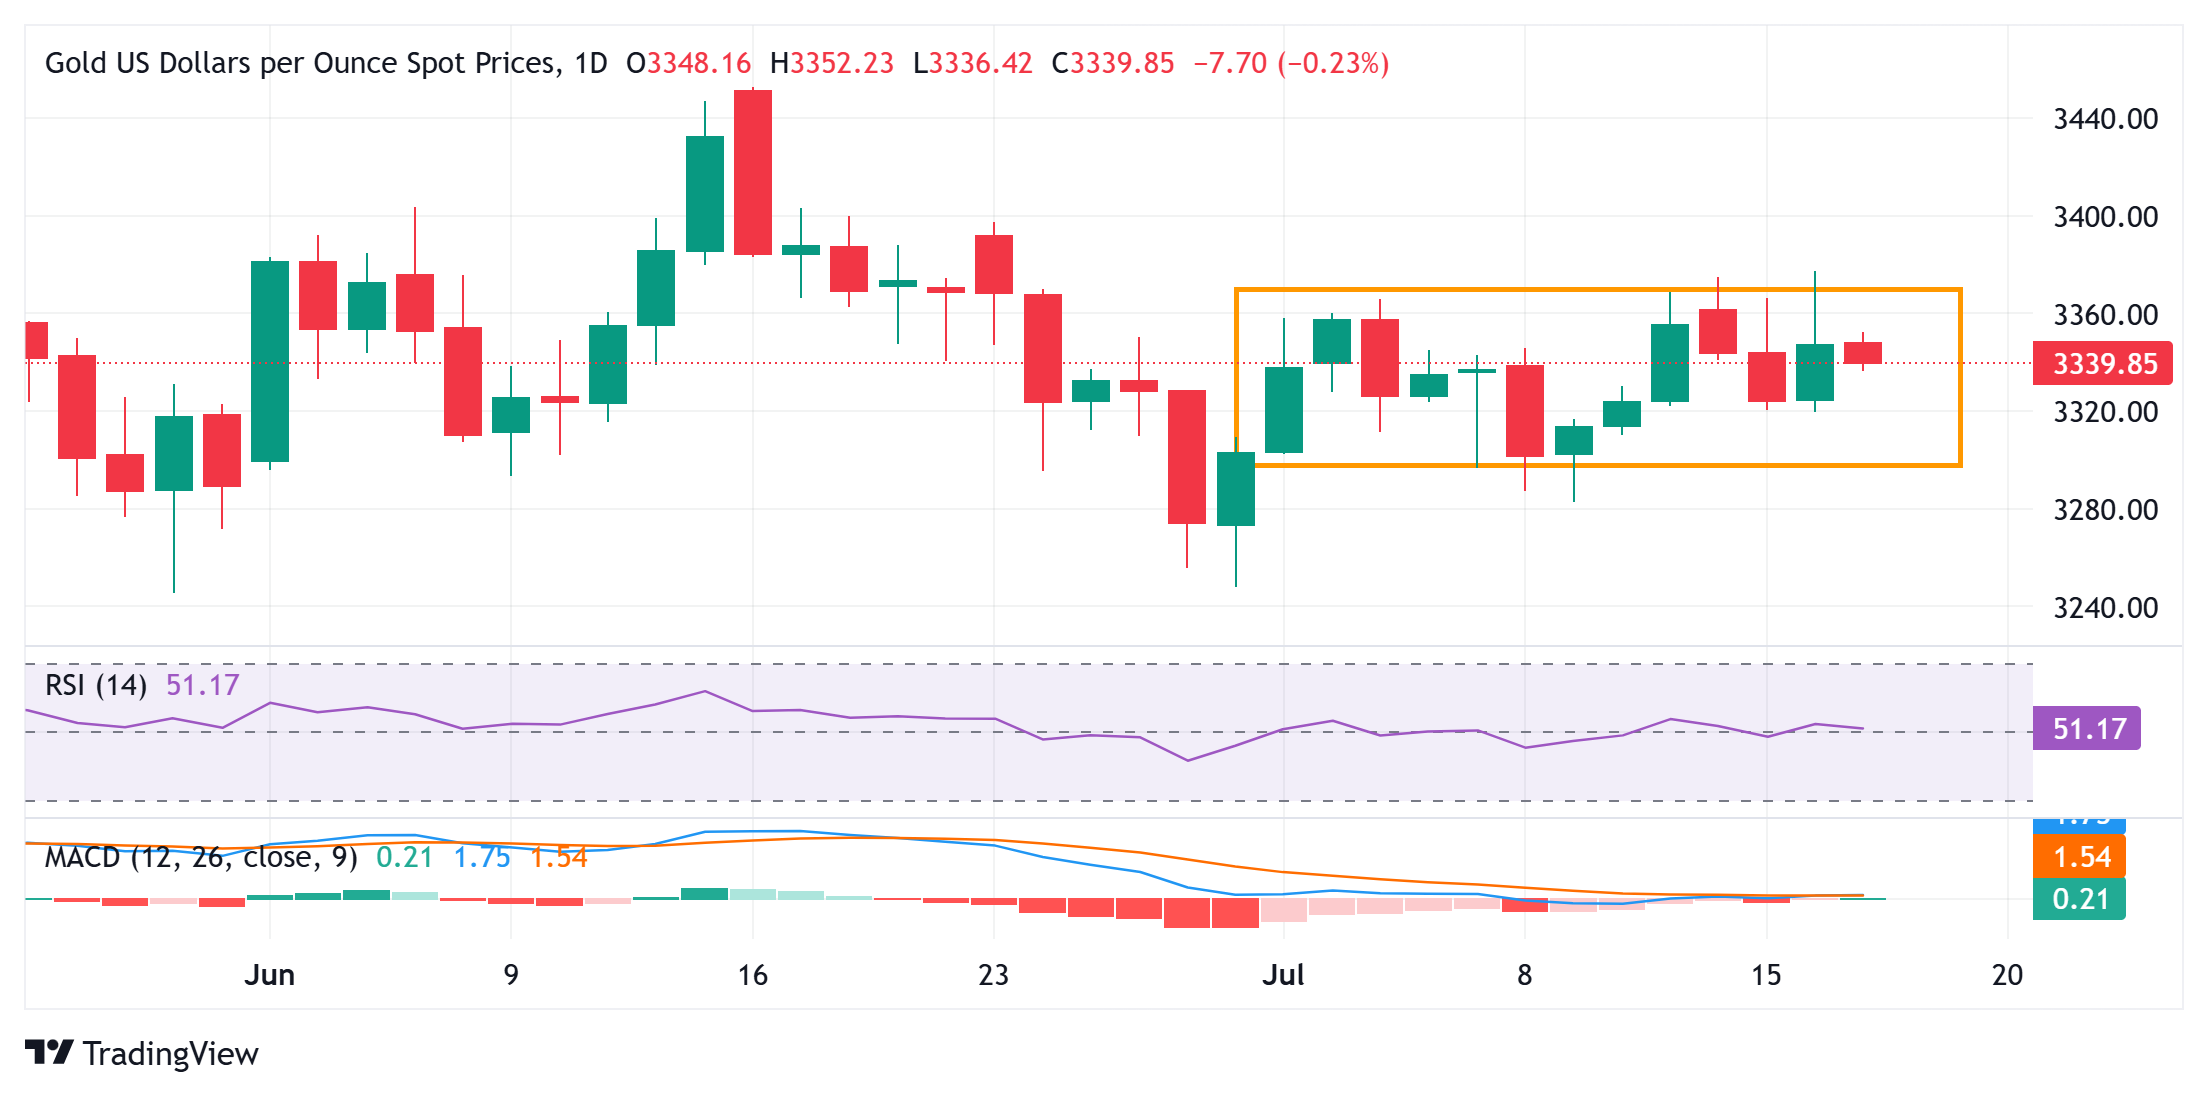
From a technical perspective, the recent price action within a range from the beginning of this month points to indecision among operators. In addition, neutral oscillators in the daily chart justify a certain caution before positioning themselves for the next phase of a directional movement. Therefore, any additional landslide is more likely to find some support near the horizontal zone of 3,322 $ -3,320 $ before the round figure of $ 3,300. Some follow-up sales below the region of 3,283 $ -3,282 $, or a minimum of one week reached last Tuesday, would lead to the price of gold to accelerate the corrective fall towards the minimum of July, around the area of 3,248 $ -3,247 $.
On the other hand, the region of 3,365 $ -3.366 $ could act as an immediate obstacle before the area of 3,377 $, or the maximum of the previous night, above which the price of gold could aspire to recover the round figure of $ 3,400. Some follow-up purchases have the potential to raise the merchandise even more towards the next relevant obstacle near the 3,434 $ -3,435 $ area.
American dollar today
The lower table shows the percentage of US dollar change (USD) compared to the main coins today. American dollar was the strongest currency against the Australian dollar.
| USD | EUR | GBP | JPY | CAD | Aud | NZD | CHF | |
|---|---|---|---|---|---|---|---|---|
| USD | 0.15% | 0.17% | 0.34% | 0.23% | 0.53% | 0.28% | 0.16% | |
| EUR | -0.15% | 0.02% | 0.17% | 0.10% | 0.40% | 0.15% | 0.04% | |
| GBP | -0.17% | -0.02% | 0.18% | 0.06% | 0.36% | 0.11% | -0.00% | |
| JPY | -0.34% | -0.17% | -0.18% | -0.17% | 0.14% | -0.07% | -0.19% | |
| CAD | -0.23% | -0.10% | -0.06% | 0.17% | 0.39% | 0.04% | -0.06% | |
| Aud | -0.53% | -0.40% | -0.36% | -0.14% | -0.39% | -0.34% | -0.36% | |
| NZD | -0.28% | -0.15% | -0.11% | 0.07% | -0.04% | 0.34% | -0.11% | |
| CHF | -0.16% | -0.04% | 0.00% | 0.19% | 0.06% | 0.36% | 0.11% |
The heat map shows the percentage changes of the main currencies. The base currency is selected from the left column, while the contribution currency is selected in the upper row. For example, if you choose the US dollar of the left column and move along the horizontal line to the Japanese yen, the percentage change shown in the box will represent the USD (base)/JPY (quotation).
Source: Fx Street
I am Joshua Winder, a senior-level journalist and editor at World Stock Market. I specialize in covering news related to the stock market and economic trends. With more than 8 years of experience in this field, I have become an expert in financial reporting.


