
The price of Stellar (XLM) in a month has increased by 103% and now holds near $ 0.47. The rally paused, and small candles appeared on daytime schedules, mostly indecisive dojs.
Two signals indicate a possible decrease: a significant amount of margin positions have accumulated at the cost, and the impulse weakens. Key support levels may be at risk.
The accumulation of positions below $ 0.40 increases the risk of a cascade
The price lasts above $ 0.45, but the XLM/USDT liquidation card for Bitget for 30 days shows about $ 79.8 million long positions against about $ 42.1 million short, with a cumulative cluster below $ 0.40. Each decrease first activates smaller clusters, but when the wave will reach the area of $ 0.40 with a large accumulation of positions, large -scale forced liquidation hit the book of orders.
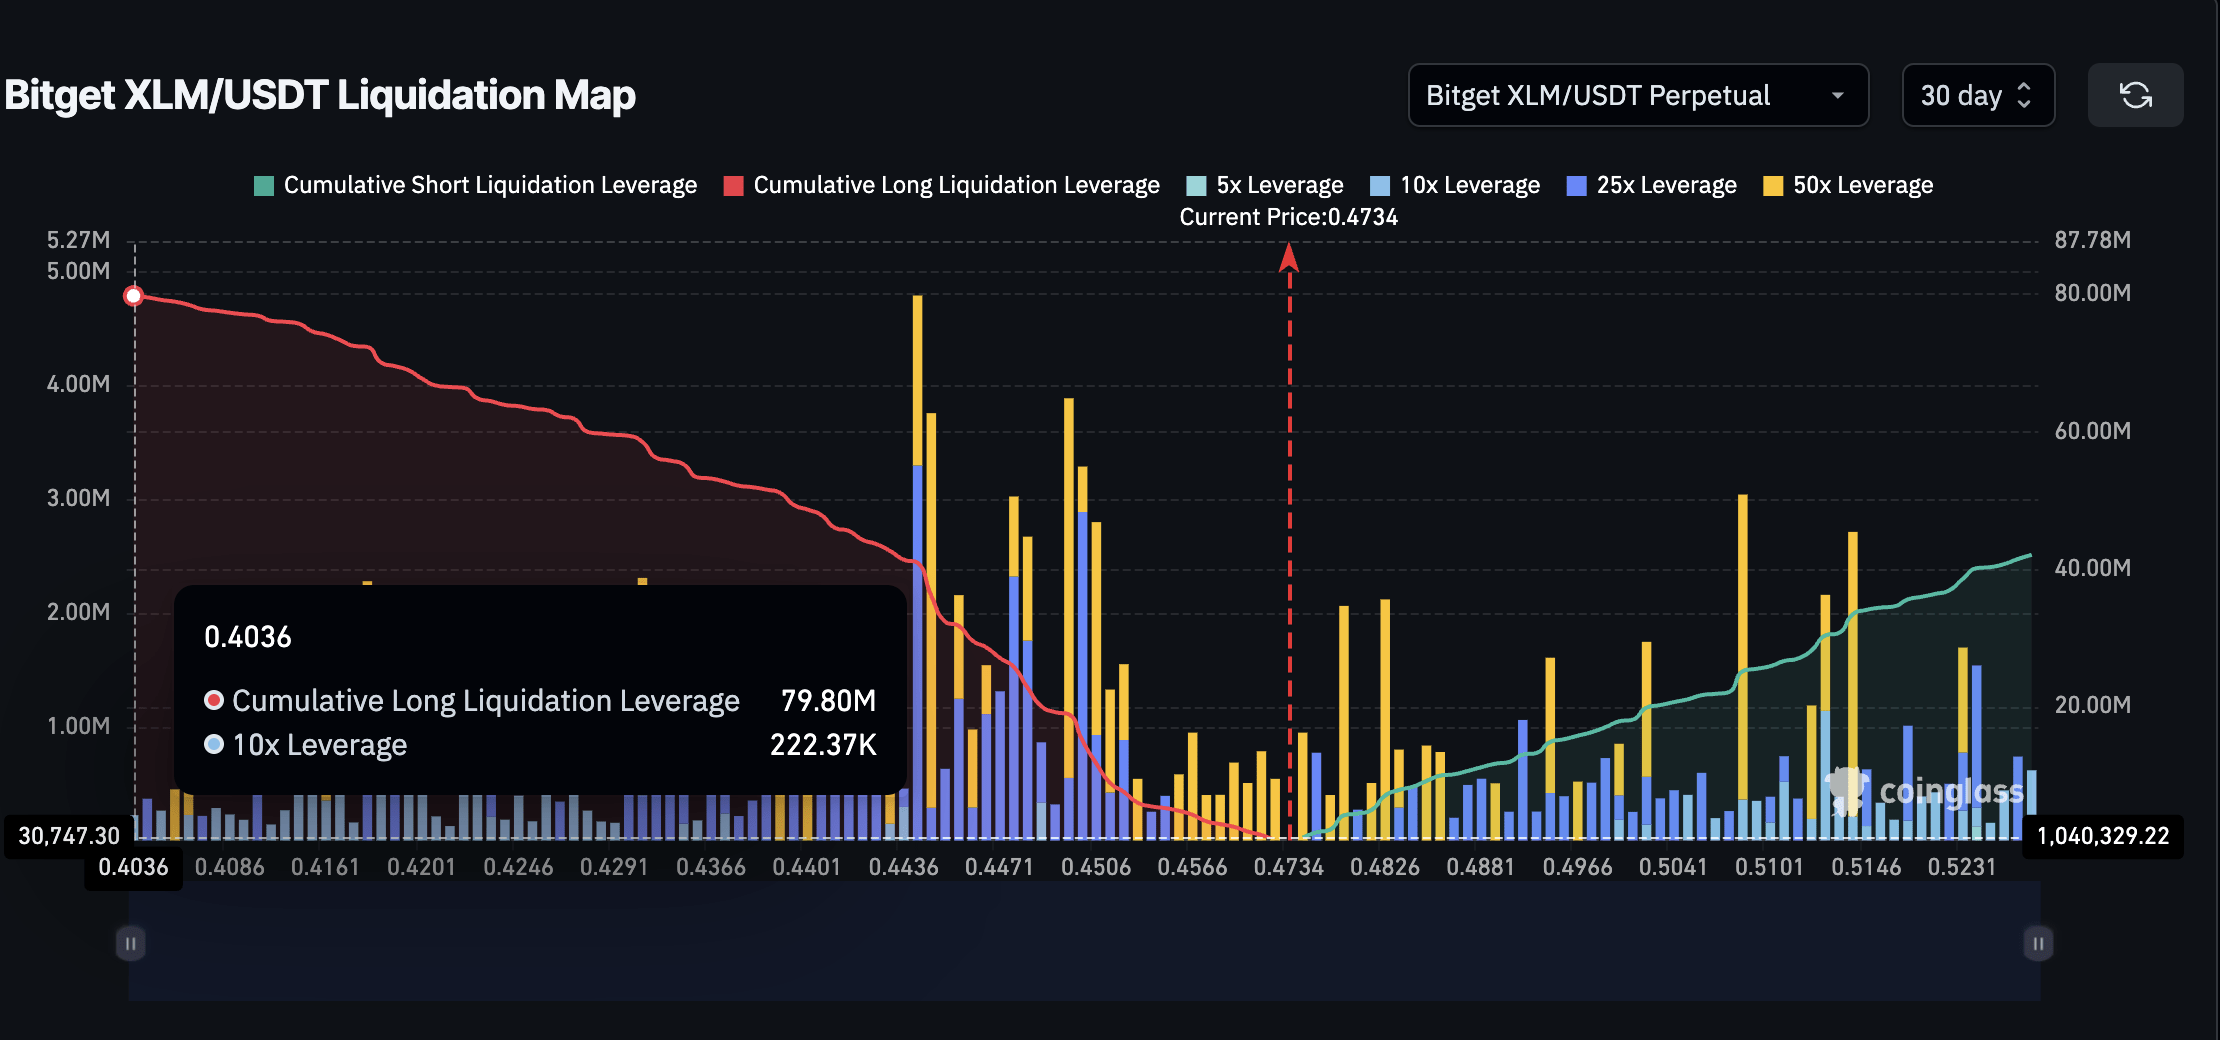
The liquidation card shows where the positions with the credit shoulder are automatically closed; When the largest clusters are below the current price, even a small fall can cause an avalanche -like effect.
Last week, an open interest in Stellar (XLM) has updated the historical maximum.
RSI divergence resembles a December fall
Since July 14, the price has been held near maximums, and the relative force (RSI) index on the day schedule forms the decreasing peaks. The last time such a picture appeared on XLM schedules at the end of December, then the price fell by more than 40%.
RSI evaluates the strength of recent price movements on a scale from 0 to 100. If the price is stable or grows, and RSI falls, a divergence occurs, which suggests that the impulse fades, and correction matures on the market. Given the risks associated with the credit shoulder and liquidation, the loss of impulse can be fatal.
The price of XLM is aimed at key support levels
Fibonacci correction from a minimum of $ 0.21 to a maximum $ 0.52 indicates the likely levels of support at the beginning of sales: $ 0.44 (0.236) – the strongest level with multiple touches. Fibonacci levels often indicate a rollback zones, and when they coincide with liquidation clusters, the signal intensifies.
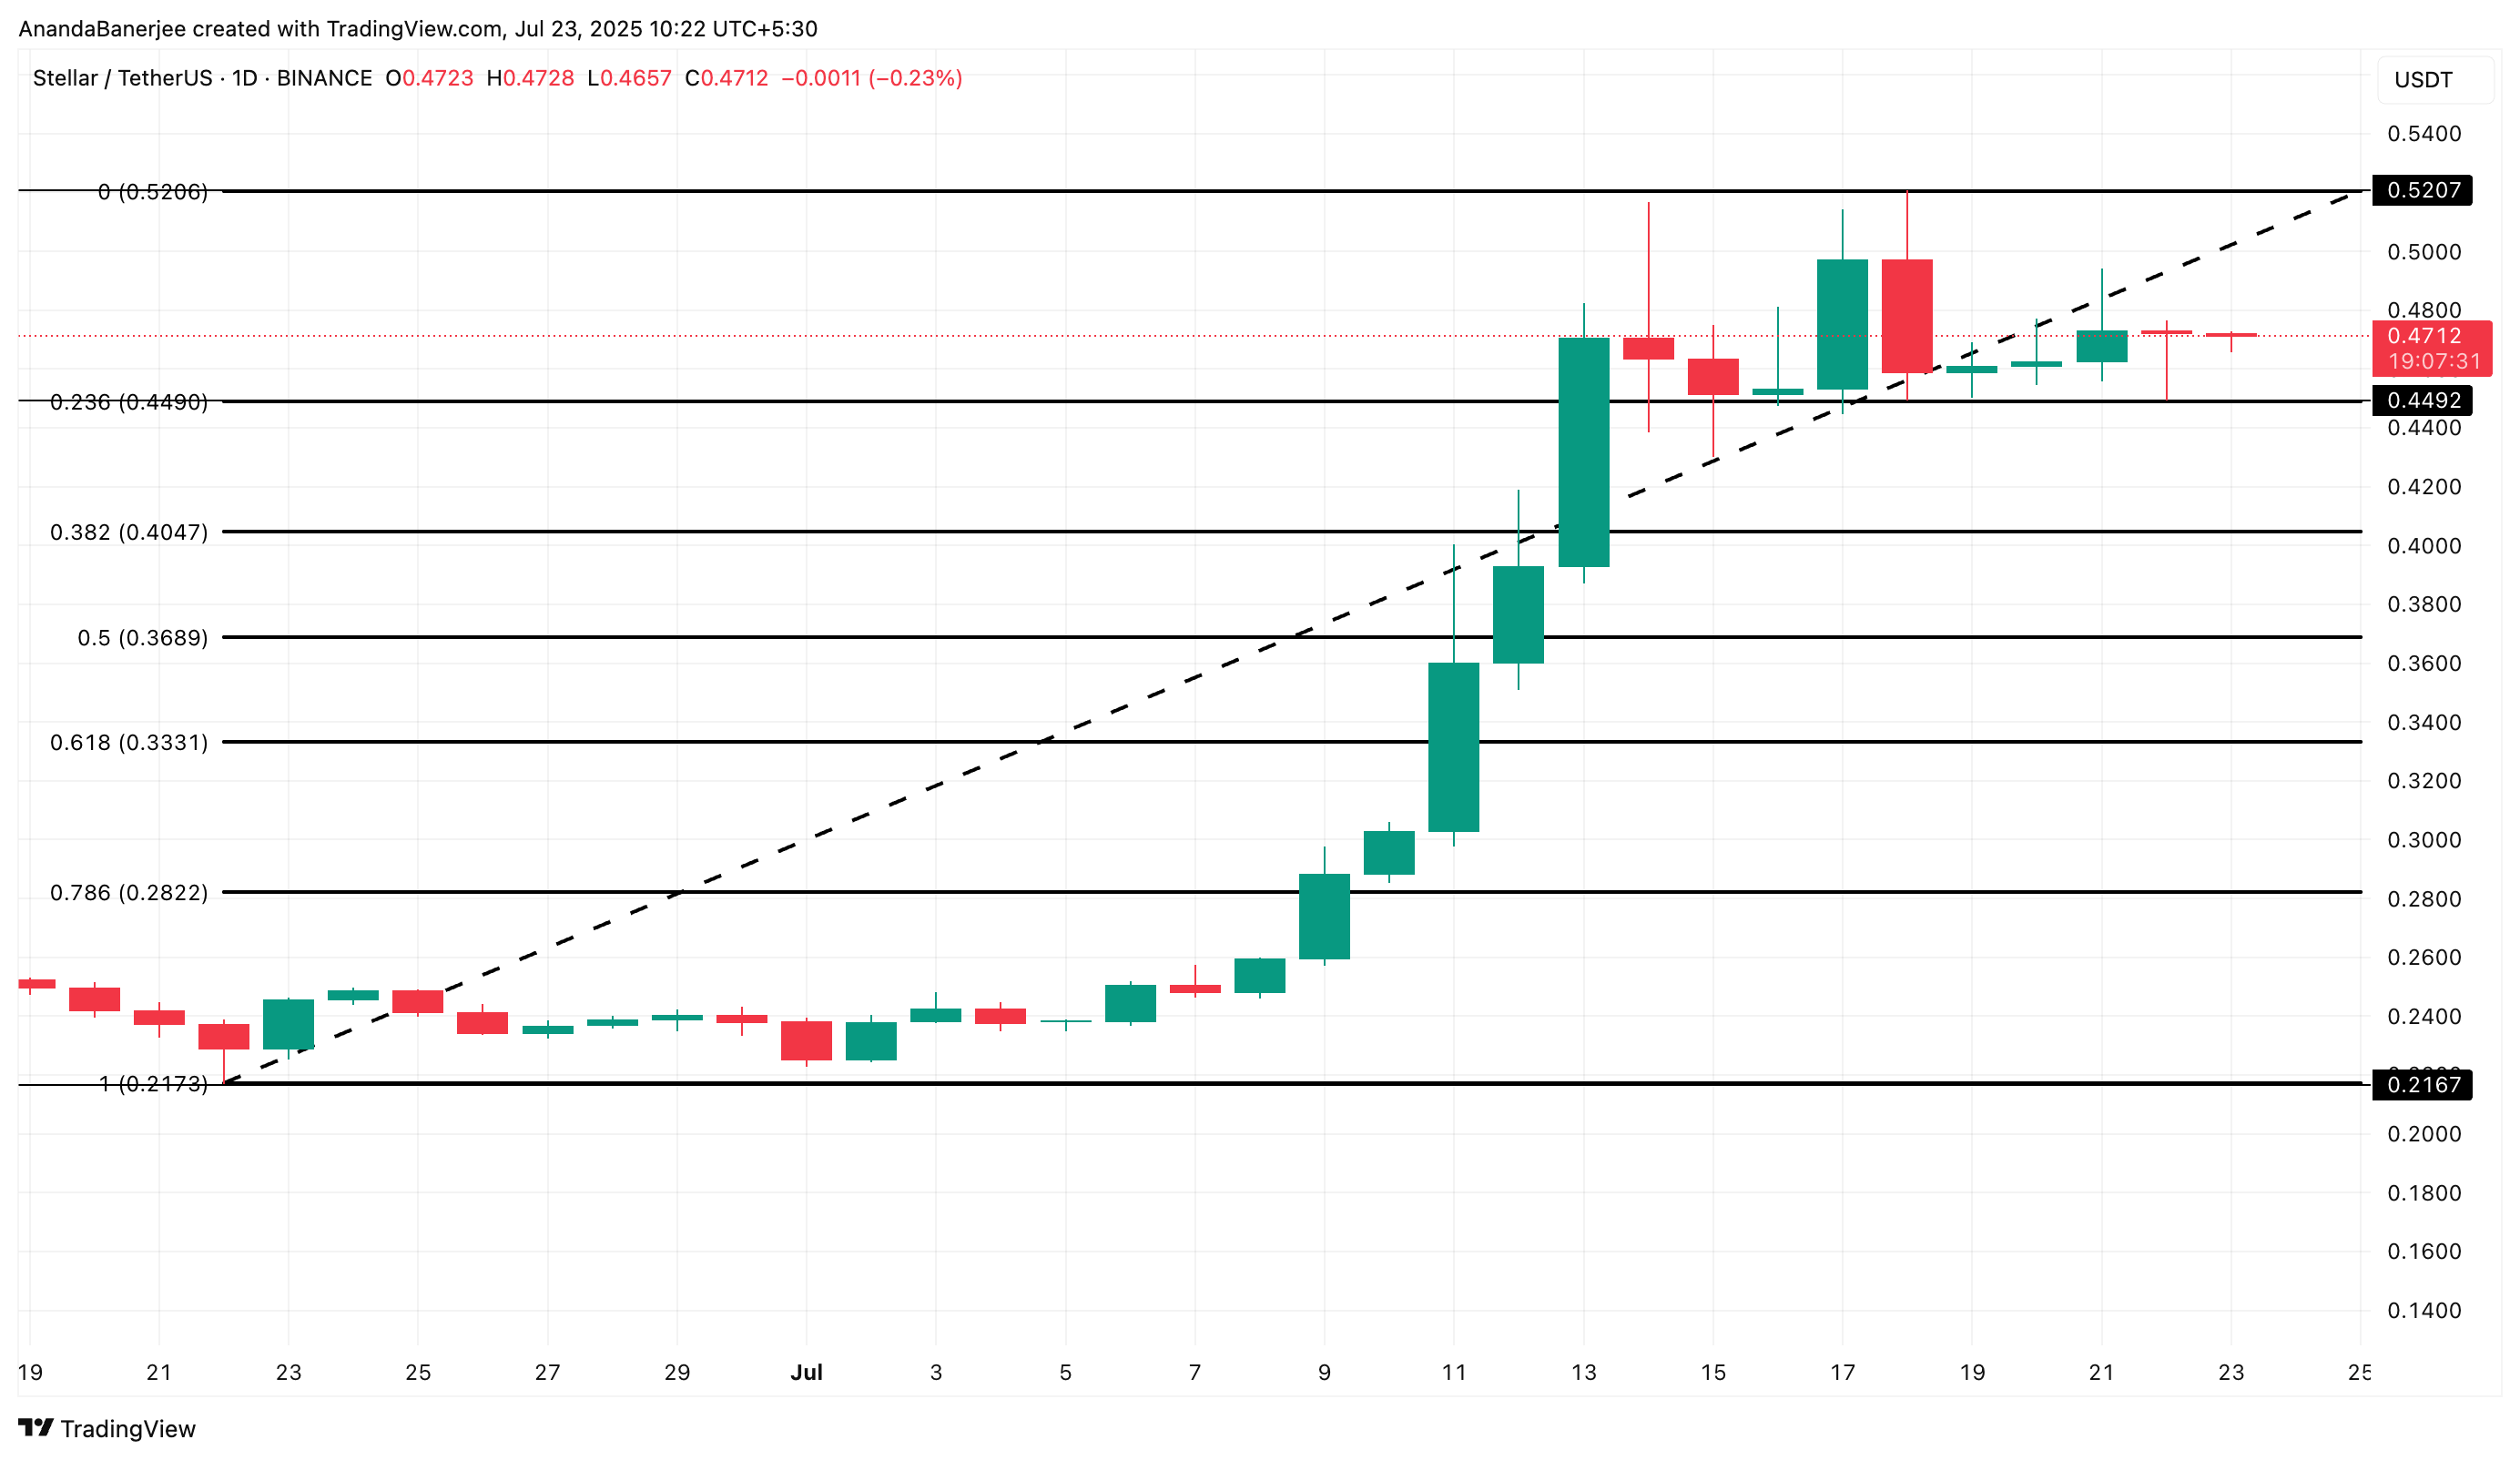
Now XLM is trading above $ 0.44. If the price closes below this level, attention will switch to $ 0.40. A breakdown below $ 0.40 will accelerate the fall to $ 0.33. A decrease by 40% of the maximum $ 0.52, as in December 2024, will lower the price below $ 0.33. If the price falls below $ 0.28 (with a breakdown of $ 0.33), the entire structure of the price of XLM can become a bear in a short term.
The script will change if the price confidently closes above $ 0.52, while RSI growth and reduction in the risk of liquidation neutralize a bear forecast and restore growth prospect.
Be in the know! Subscribe to Telegram.
Source: Cryptocurrency
I am an experienced journalist and writer with a career in the news industry. My focus is on covering Top News stories for World Stock Market, where I provide comprehensive analysis and commentary on markets around the world. I have expertise in writing both long-form articles and shorter pieces that deliver timely, relevant updates to readers.


