- The S&P 500 stock index concludes with a loss of 0.24% on the day.
- Constellation Energy (CEG) shares plummet 12.13% at market close.
- Public Service Enterprise (PEG) falls 6.18% after releasing its earnings report.
- Investors will focus their attention on the US presidential election.
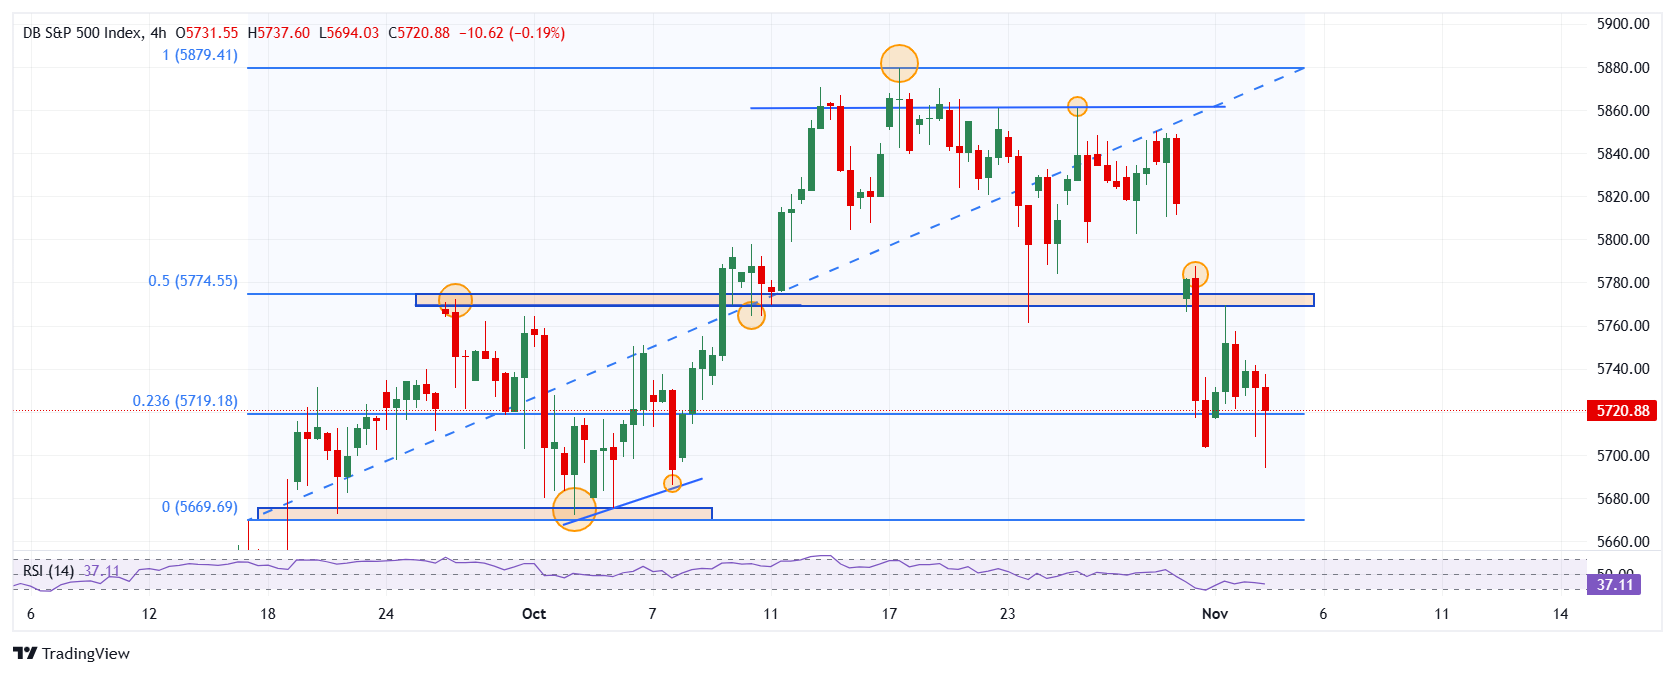
The S&P 500 set a day’s high at 5,748, where it attracted aggressive sellers that drove the index to a near four-week low of 5,694. Currently, the S&P 500 trades above 5,714, losing 0.24% at the close of the session.
Public Service Enterprise and Constellation Energy drag the S&P 500 into negative territory
The company specialized in offering energy solutions, Constellation Energy (CEG), published its earnings report in which it obtained revenues of 6.55 billion dollars, above the 5.71 billion dollars expected by the market, as well as an earnings per share of $2.74 versus the consensus of $2.63. Despite exceeding expectations, CEG shares sank 12.13%, trading above $226.90 at the end of the session. This drop is due to the decision by the Federal Energy Regulatory Commission to block the supply of additional energy to an Amazon data center provided by Talen (TLN), affecting companies that confirm the energy sector.
On the other hand, Public Service Enterprise (PEG) shares fell 6.18% after releasing its quarterly report, generating revenue of 2.64 billion dollars compared to the 2.13 billion dollars expected by analysts. Likewise, it obtained an earnings per share of $0.9, higher than the $0.87 projected by the market. These figures were not enough to maintain investor confidence and punished the stock, taking it to lows not seen since September 11 at $81.87.
Investors’ attention will be on the development of the United States presidential elections tomorrow, a close day is expected between former president and Republican candidate Donald Trump and Democratic candidate Kamala Harris.
Levels to consider in the S&P 500
The S&P 500 with a short-term resistance located at 5,787, given by the maximum of October 31, in convergence with the 50% Fibonacci retracement. We see the next key resistance zone at 5,860, the pivot point of October 25.
On the downside, the key support zone is at 5,672, given by the October 2 low. The Relative Strength Index is at 37.11, below the midline of 50, showing short-term strength from sellers with intentions to visit the 5,660 area.
S&P 500 4-hour chart

Source: Fx Street
I am Joshua Winder, a senior-level journalist and editor at World Stock Market. I specialize in covering news related to the stock market and economic trends. With more than 8 years of experience in this field, I have become an expert in financial reporting.


