
- The S&P 500, the Dow Jones and the Nasdaq posted losses in a risk-off environment.
- The dollar index falls more than 1.50%, dragged down by the fall in US Treasury yields; gold rebounded.
US equities recovered some ground during the day, but remains poised to finish lower, despite efforts by investors for a last-minute rally. At the time of writing, the S&P 500, Dow Jones Industrials and Hi-Tech Nasdaq Composite are down 0.13% to 0.70%, trading at 3,904.92, 11,398.96 and 31,268.98, respectively.
Sentiment remains gloomy, accentuated by the stagflation scenario surrounding the world economy. The coronavirus crisis in China continues as local outbreaks raise concerns about further lockdowns. In addition, high inflationary pressures have taken their toll on large US retailers such as Walmart and Target, which have said their margins have shrunk due to high prices.
Fed officials have made statements in recent days, with most of them saying inflation is “too high” and reiterating a stance to raise the Federal Funds Rate (FFR) by 50 basis points at the meeting. of June. Kansas City Fed President Esther George said a “tough week in equity markets” would not change her view of raising rates, while Philadelphia Fed Patrick Harker added the US economy could have a few quarters of negative growth, but that’s not what you expect.
Meanwhile, the USD weakens further on the week, over 1.50%. The dollar index, a gauge of the value of the dollar, stands at 102.751, losing 1.11% on Thursday. The 10-year US Treasury yield extended its losses on the day, four basis points below the open and currently stands at 2,850%.
As for the sectors, the winners are Materials, Consumer Discretionary and Energy, which rose 1.23%, 0.84% and 0.69%, respectively. The sectors with the worst results are basic consumer goods, finance and technology, which fell by 1.74%, 0.54% and 0.50% each.
In the commodity complex, US benchmark oil, WTI, gains 2.70%, trading at $112.00 a barrel, while precious metals, such as gold (XAU/USD), rise 1.35%, trading at $1,840.88 a troy ounce, helped by a softer US dollar.
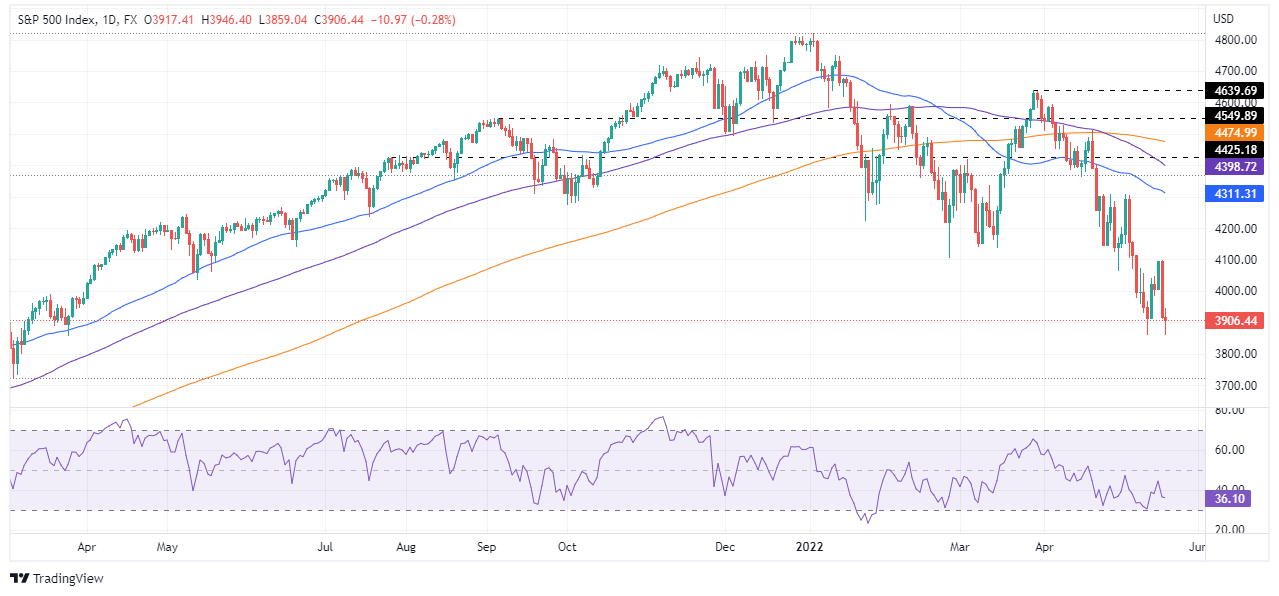
S&P 500 daily chart
Technical levels
Source: Fx Street
With 6 years of experience, I bring to the table captivating and informative writing in the world news category. My expertise covers a range of industries, including tourism, technology, forex and stocks. From brief social media posts to in-depth articles, I am dedicated to creating compelling content for various platforms.


