
- The US dollar drops on Friday in a light trade for the festivities, breaking a two -day streak run.
- Tariff tensions resurface while Trump prepares to send letters by imposing unilateral commercial tariffs from August 1.
- The “great and beautiful bill” of the US President passes through the House of Representatives, increasing concerns about long -term debt.
The US dollar (USD) weakens on Friday, descending in a trade reduced by the festivities and breaking a two -day streak. After climbing thanks to the data of non -agricultural payrolls of the US, the most expected published on Thursday, the dollar is now reducing its profits, since the market activity remains off in the middle of the celebrations of the Independence Day of July 4 in the United States.
The dollar index (DXY), which measures the performance of the dollar against a basket of main currencies, is falling during the European negotiation session. At the time of writing, the index is around 96.90, retreating a weekly maximum of 97.42 reached on Thursday after the employment data in the US stronger than expected.
The setback occurs while the operators weigh the solid employment figures in the US in the face of broader risks, including the protectionist rates of President Donald Trump and the growing tax concerns after the approval of his massive tax and expenses bill.
The legislation, approved by the House of Representatives on Thursday, is projected that the budget deficit will significantly expand, feeding the anxiety of investors on the long -term stability of the US public finances of the US, although the optimistic data of the labor market initially raised the US dollar, the fears around the protectionist commercial measures and the growing levels of debt are now weighing on the feeling.
President Trump has intensified tariff tensions before the deadline of July 9. He announced Thursday that he would begin sending letters to his commercial partners this Friday. His intention is, as he said, send “10 or 12” letters to key commercial partners, with more to come in the next few days, each one delineating the unilateral tariff rates that will enter into force on August 1. Trump also added, referring to this, “it will vary in value from perhaps 60 or 70% tariffs to 10 and 20% of tariffs,” underlining a more aggressive protectionist position just days before the deadline of July 9.
Market movements: Trump’s fiscal project and the revaluation of rates cuts
- The broad “great and beautiful bill” of President Donald Trump was approved by the House of Representatives late Thursday by a narrow margin of 218–214, with two Republican legislators voting against. The package of several billion dollars, which includes deep tax cuts and an increase in federal expenditure, has intensified market concerns about the long -term trajectory of the US debt. The bill is expected to be signed by Trump this Friday as part of the celebrations of Independence Day.
- The “great and beautiful bill” has drawn stretch political battle lines in Washington. Republicans have acclaimed their approval as a great economic victory and compliance with the campaign promises of the US president, citing tax cuts, improved border defense and safety spending. In contrast, the Democrats unanimously opposed the legislation, warning that it would deepen inequality, increase the federal deficit and strip millions of Americans of health coverage. The partisan stagnation is adding a layer of uncertainty for markets, particularly as the long -term economic impact of the bill becomes a conflict point before the mid -term elections of 2026.
- The Trump bill makes the 2017 tax cuts permanent and adds new fiscal benefits, including the elimination of federal tips and deductions for overtime. It also raises the SALT deduction limit to $ 40,000 for five years. On the other hand, the project includes deep clippings to Medicaid, making it difficult for low -income Americans to qualify, and restrict certain types of attention. It hardens the rules on food coupons, cut funds for green energy programs and reserve more than 46,000 million dollars for border security and the application of immigration. The “great and beautiful bill” also raises the US debt roof in 5 billion dollars.
- The non -partisan Congress Budget Office (CBO) estimates that the new fiscal project approved will add 3.4 billion dollars to US deficits during the next ten years. It is projected that the National Debib Relationship rises from 97.8% to more than 125%, well above the previous projection of the CBO of 117.1% issued in January.
- Non -agricultural payroll (NFP) data published Thursday showed that US economy added 147,000 jobs in June, exceeding market expectations and reducing US unemployment rate to 4.1%. While hiring in the private sector was slower, the general strength of the report led operators to reduce the expectations of an interest rate cut by the Federal Reserve (Fed) in July. According to the CME Fedwatch tool, the probabilities of a cut have fallen from 24% to only 4.7% after the report. The president of the FED, Jerome Powell, has repeated that the Central Bank will expect more cooling signals both in employment and inflation before making a decision.
- The US Treasury Secretary, Scott Besent, sharpened his criticism of the Fed on Thursday, stating that the FOMC is “a little diverted” in his judgment by keeping the stable rates despite what he called “very high real rates.” Besent added, “if they do not cut now, the cut in September could have to be older.” Despite the aggressive tone of the Fed, the futures markets are inclined towards a moderate posture, valuing by 80% the possibility of a 25 basic points (PBS) in September and a total of 50 PBS in relaxation by the end of 2025.
DXY technical perspective: The breakdown of the wedge pattern is maintained while the US dollar fails to recover 97.00
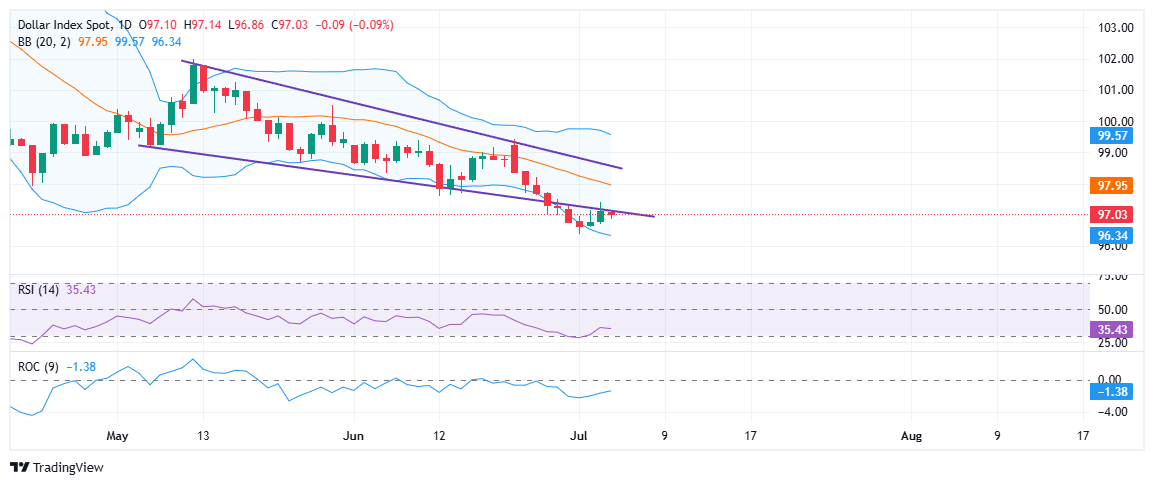
The dollar index (DXY) broke below a descending wedge pattern earlier this week. The index tried to recover the 97.00 mark on Thursday after the stronger non -agricultural payroll data than expected, but failed to stay above it. The rebound stopped right in the rota wedge support, which has now become resistance. This failed attempt of reflection reinforces the bearish configuration, since the DXY goes down during the negotiation session of Friday, quoting just below the threshold of 97.00.
The price is also below the 20 -day mobile average, which also serves as Bollinger’s middle band, indicating that the rise impulse is still weak. Unless the bulls achieve a clean break over this area about 97.00–97.20, it is likely that the broader bassist trend is maintained.
Impulse indicators also reflect a cautious tone. The relative force index (RSI) is around 34, remaining in bassist territory but showing early stabilization signs. Meanwhile, the exchange rate (ROC) remains negative, indicating that the sale pressure is still present, although it is not being accelerated.
If the DXY breaks below its immediate support about 96.30, Bollinger’s lower band, could open the door to a new downward movement with a 95.00 target. On the other hand, a strong closure above the wedge could trigger a short -term recovery, but for now, the US dollar remains under pressure.
American dollar today
The lower table shows the percentage of US dollar change (USD) compared to the main coins today. American dollar was the strongest currency against the Australian dollar.
| USD | EUR | GBP | JPY | CAD | Aud | NZD | CHF | |
|---|---|---|---|---|---|---|---|---|
| USD | -0.04% | 0.09% | -0.36% | 0.08% | 0.38% | 0.19% | -0.12% | |
| EUR | 0.04% | 0.17% | -0.31% | 0.15% | 0.30% | 0.22% | -0.02% | |
| GBP | -0.09% | -0.17% | -0.45% | 0.00% | 0.16% | 0.07% | -0.20% | |
| JPY | 0.36% | 0.31% | 0.45% | 0.46% | 0.62% | 0.49% | 0.15% | |
| CAD | -0.08% | -0.15% | -0.00% | -0.46% | 0.14% | 0.07% | -0.20% | |
| Aud | -0.38% | -0.30% | -0.16% | -0.62% | -0.14% | -0.13% | -0.36% | |
| NZD | -0.19% | -0.22% | -0.07% | -0.49% | -0.07% | 0.13% | -0.27% | |
| CHF | 0.12% | 0.02% | 0.20% | -0.15% | 0.20% | 0.36% | 0.27% |
The heat map shows the percentage changes of the main currencies. The base currency is selected from the left column, while the contribution currency is selected in the upper row. For example, if you choose the US dollar of the left column and move along the horizontal line to the Japanese yen, the percentage change shown in the box will represent the USD (base)/JPY (quotation).
Source: Fx Street
I am Joshua Winder, a senior-level journalist and editor at World Stock Market. I specialize in covering news related to the stock market and economic trends. With more than 8 years of experience in this field, I have become an expert in financial reporting.


