
- The USD/JPY falls from the maximums of 155.86, establishing in 154.51 amid the volatility induced by tariffs.
- The ISM manufacturing PMI rises, pointing out a robust business activity despite global commercial fears.
- The Bank of Japan maintains an optimistic perspective, ready to navigate Trump’s protectionist policies.
The USD/JPY retreated from the maximum daily of 155.86 reached after the US president, Donald Trump, advanced in his protectionist policies, imposing tariffs in Canada, Mexico and China. Initially, the dollar rose, but as the fears faded, the pair fell below its opening price by 0.44% and quoted in 154.51.
The Yen is strengthened after the initial fall while Trump’s new tariffs concern the markets
Market participants seem worried, as evidenced by the trade of global red actions. The president of the United States, Trump, applied 25% tariffs to Canada and Mexico and 10% to China. The US US partners promised retaliation measures, while the latter would defy this policy in the World Trade Organization (WTO).
At the time of writing, the ISM manufacturing PMI for January increased to 50.9, exceeding 49.8 forecasts. It rose from 49.2 in December, an indication of improvement in business activity. Deepen the data, the paid price subcomponent advanced from 52.5 to 54.9, while the employment index improved from 45.4 in December to 50.3.
Meanwhile, during the Asian session, the Bank of Japan revealed its summary of opinions of the January meeting. Some of the members added that inflation expectations are increasing as prices exceed 2%inflation target, and others said that increasing rates would be neutral enough. Those responsible for politics affirmed that Japan’s economy is resilient and can navigate through the protectionist policies implemented by Trump.
This week, the US economic agenda will include speeches from Fed members, Jolts work orders and factory orders on February 4. In Japan, the calendar is light with the final publication of the Jibun Bank services for January.
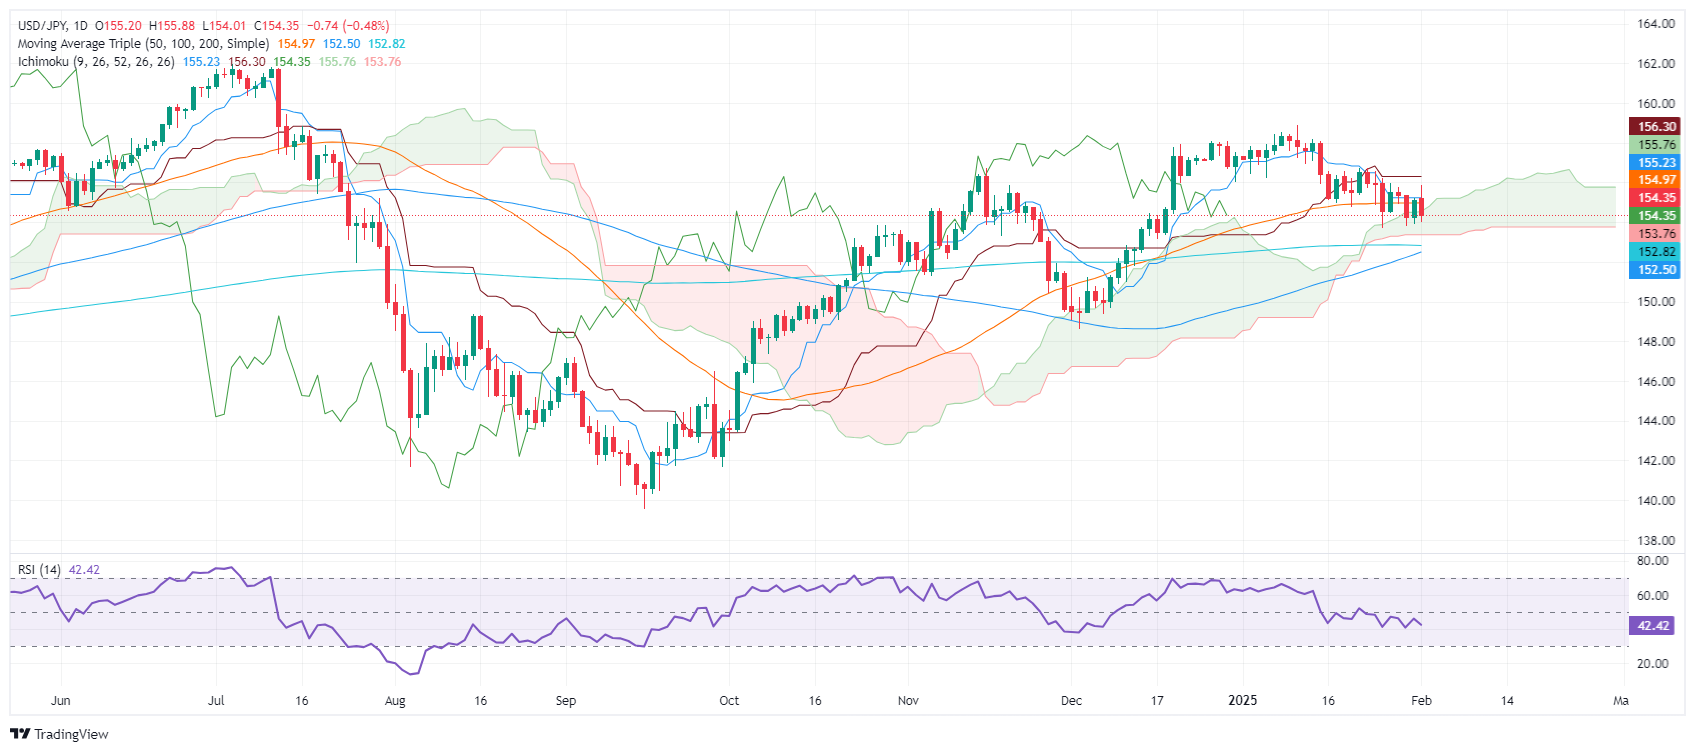
USD/JPY Price Analysis: Technical Perspective
The USD/JPY is forming a ‘bearish candle’ with a long upper shadow, an indication that the pair is not finding acceptance within the range of 154.78-155.88. This is bassist, as seen in the price action, with the pair extending its bearish trend inside the Ichimoku cloud (Kumo). Sellers are observing the next support in the Senkou Span B in 153.76.
With greater weak
On the other hand, if buyers achieve a daily closure above 155.00, look for more increases. The key resistance is found in the Senkou Span A at 155.76.
And in Japanese price today
The lower table shows the rate of change of Japanese Yen (JPY) compared to the main currencies today. Yen Japanese was the strongest currency against the New Zealand dollar.
| USD | EUR | GBP | JPY | CAD | Aud | NZD | CHF | |
|---|---|---|---|---|---|---|---|---|
| USD | 0.69% | 0.16% | -0.48% | -0.48% | 0.70% | 0.30% | -0.34% | |
| EUR | -0.69% | -0.21% | 0.08% | -0.09% | 0.39% | 0.70% | 0.06% | |
| GBP | -0.16% | 0.21% | -0.86% | 0.12% | 0.61% | 0.91% | 0.28% | |
| JPY | 0.48% | -0.08% | 0.86% | -0.12% | 1.32% | 1.54% | 0.67% | |
| CAD | 0.48% | 0.09% | -0.12% | 0.12% | 0.19% | 0.78% | 0.15% | |
| Aud | -0.70% | -0.39% | -0.61% | -1.32% | -0.19% | 0.30% | -0.43% | |
| NZD | -0.30% | -0.70% | -0.91% | -1.54% | -0.78% | -0.30% | -0.63% | |
| CHF | 0.34% | -0.06% | -0.28% | -0.67% | -0.15% | 0.43% | 0.63% |
The heat map shows the percentage changes of the main currencies. The base currency is selected from the left column, while the contribution currency is selected in the upper row. For example, if you choose the Japanese yen from the left column and move along the horizontal line to the US dollar, the percentage change shown in the picture will represent the JPY (base)/USD (quotation).
Source: Fx Street
I am Joshua Winder, a senior-level journalist and editor at World Stock Market. I specialize in covering news related to the stock market and economic trends. With more than 8 years of experience in this field, I have become an expert in financial reporting.


