
- The Japanese Yen advances ahead of Thursday's US PMI release.
- Japan's manufacturing PMI rose to 50.5 in May from 49.6 in April, suggesting the first expansion since May 2023.
- The US dollar gained ground after the FOMC Minutes cast doubt on the Fed's willingness to press ahead with rate cuts.
The Japanese Yen (JPY) shows a slight upward movement after the Bank of Japan (BoJ) announced on Thursday that it was leaving the amounts of Japanese government bonds (JGB) unchanged from the previous operation. More than a month ago, the BoJ cut the amount of 5-10 years it bought in a scheduled operation.
The Yen avoided cheering on Japan's Purchasing Managers' Index (PMI) data showing private sector growth hit a nine-month high in May as manufacturing activity returned to expansion.
The US Dollar (USD) remains firm ahead of US PMI data due out on Thursday. However, the dollar gained ground on Wednesday, with the publication of the minutes of the latest monetary policy meeting of the Federal Open Market Committee (FOMC).
Federal Reserve (Fed) policymakers have expressed concern about the slow progress of inflation, which has shown greater persistence than initially expected in early 2024. As a result, the Fed is cautious about moving forward in interest rate cuts.
Daily Market Movements: Japanese Yen Remains Calm Ahead of US PMIs
- Tensions rise after the inauguration of Lai Ching-te as the new president of Taiwan. Chinese state media reports that China has deployed numerous fighter jets and carried out simulated attacks in the Taiwan Strait and around Taiwan-controlled island groups.
- Japan's manufacturing Purchasing Managers' Index (PMI), published monthly by Jibun Bank and S&P Global, rose to 50.5 in May from 49.6 in April, beating market expectations of 49.7. This is the first growth since May 2023. Meanwhile, the services PMI fell to 53.6 from 54.3 previously, still indicating the fastest expansion in eight months.
- On Wednesday, Japan's merchandise trade balance showed the trade deficit widened to 462.5 billion yen in April, swinging from the previous surplus of 387 billion yen. This result exceeded market expectations of a deficit of 339.5 billion yen. The deficit was mainly due to the recent depreciation of the Yen, which caused an increase in the value of imports, which offset gains from increased exports.
- The yield on Japan's 10-year government bond surpassed 1% on Wednesday for the first time since May 2013, boosted by traders' growing bets that the Bank of Japan will tighten policy further in 2024.
- According to CME's FedWatch tool, the probability that the Federal Reserve will implement a 25 basis point rate cut in September has seen a slight decrease to 50.7%, compared to 51.6% a day ago.
- The president of the Federal Reserve Bank of Boston, Susan Collins, spoke on Tuesday at the event titled “Central banking in the post-pandemic financial system.” Collins stated that progress toward adjusting interest rates will take more time and she stressed that patience is the appropriate policy for the Fed, according to Reuters.
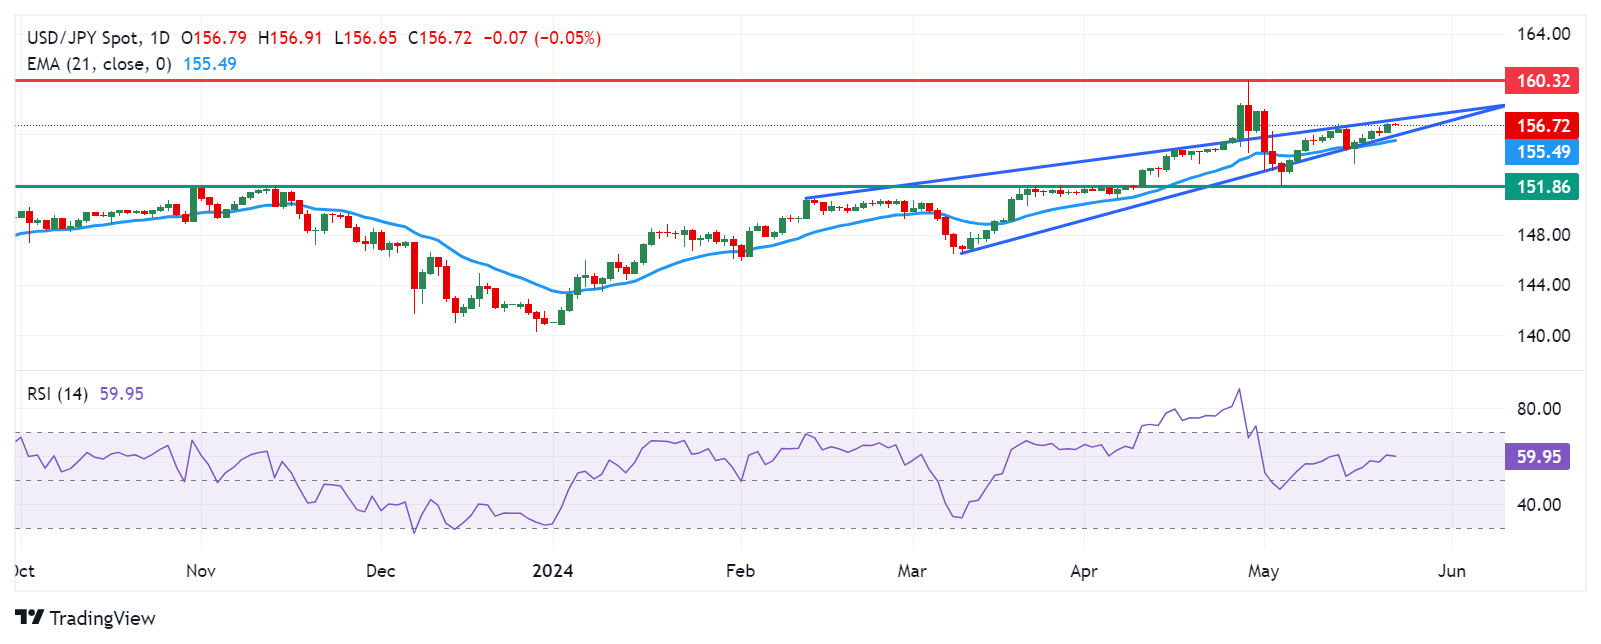
Technical analysis: USD/JPY remains above 156.50 level
The USD/JPY pair is trading around 156.70 on Thursday. A rising wedge on the daily chart indicates a bearish turn, as the price of the USD/JPY pair moves towards the tip of the wedge. However, the momentum indicator, the 14-day RSI, is still positioned slightly above the 50 mark. A new pullback would be considered a change in momentum.
The USD/JPY pair could retest the upper boundary of the ascending wedge near the psychological barrier at 157.00. If it breaks above this level, the pair could advance towards the recent high of 160.32.
To the downside, the lower threshold of the ascending wedge would act as immediate support, followed by the 21-day EMA at 155.49. A break below this level could put downward pressure on the USD/JPY pair, potentially moving it towards the retracement support at 151.86.
USD/JPY: Daily Chart
Japanese yen price today
The following table shows the percentage variation of the Japanese yen (JPY) against the main currencies listed today. The Japanese yen was the strongest currency against the pound sterling.
| USD | EUR | GBP | CAD | AUD | JPY | NZD | CHF | |
| USD | -0.10% | 0.10% | -0.10% | -0.13% | 0.02% | -0.24% | -0.09% | |
| EUR | 0.10% | 0.20% | 0.01% | -0.03% | 0.13% | -0.14% | 0.00% | |
| GBP | -0.09% | -0.18% | -0.17% | -0.22% | -0.08% | -0.33% | -0.19% | |
| CAD | 0.09% | -0.01% | 0.19% | -0.04% | 0.12% | -0.15% | -0.01% | |
| AUD | 0.13% | 0.02% | 0.23% | 0.03% | 0.13% | -0.12% | 0.02% | |
| JPY | -0.02% | -0.12% | 0.04% | -0.09% | -0.13% | -0.27% | -9911.29% | |
| NZD | 0.24% | 0.14% | 0.34% | 0.15% | 0.11% | 0.26% | 0.15% | |
| CHF | 0.11% | 0.01% | 0.20% | 0.01% | -0.04% | 0.11% | -0.14% |
The heat map shows the percentage changes of the major currencies against each other. The base currency is chosen in the left column, while the quote currency is chosen in the top row. For example, if you choose the Euro in the left column and scroll down the horizontal line to the Japanese Yen, the percentage change that appears in the box will represent EUR (base)/JPY (quote).
Source: Fx Street
I am Joshua Winder, a senior-level journalist and editor at World Stock Market. I specialize in covering news related to the stock market and economic trends. With more than 8 years of experience in this field, I have become an expert in financial reporting.


