
SOLANA rally slowed down. Over the past month, SOL has grown by 22+%, but over the past seven days it has lost almost 6%
Perhaps the Solana project token is now simply carrying out a healthy correction. However, some onchain-metrics indicate that it can drag on longer than expected.
SOPR and liquidation indicate a bear pressure
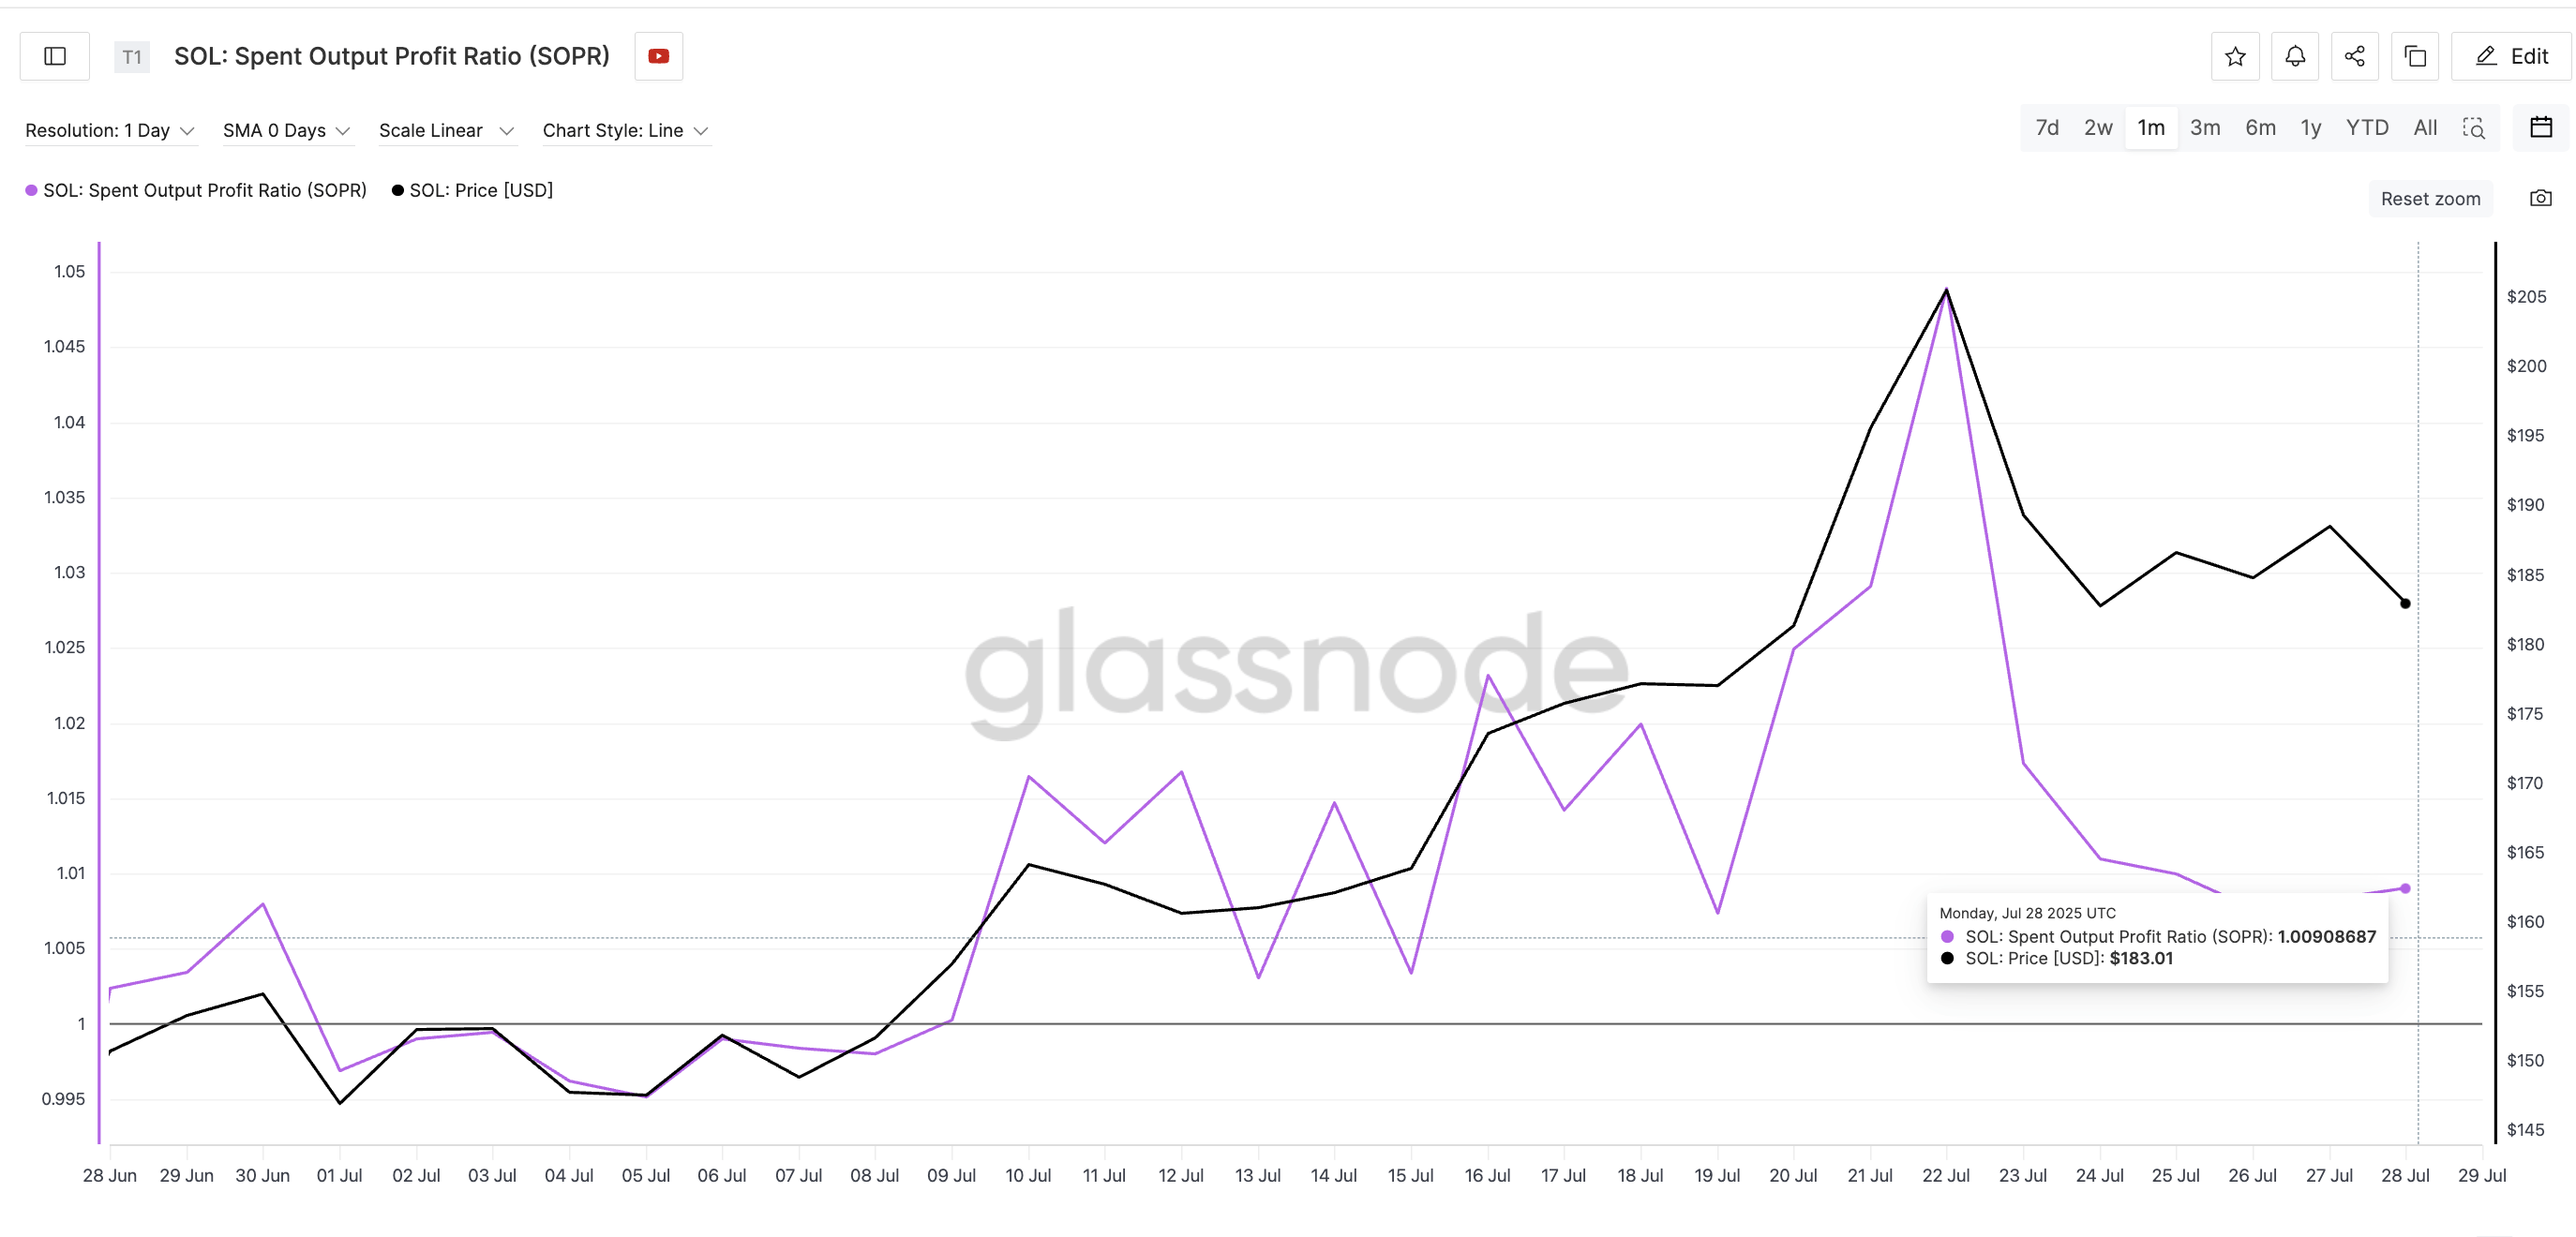
One of the signs of possible further correction is SOPR (Spent Output Profit Ratio). The indicator is calculated by dividing the dollar cost of sale by the purchase price. To do this, it relies on data on unused residues by transactions (Unspent Transaction Outputs, UTXO). The metric shows whether the holders sell their tokens with profit or loss.
SOPR for SOLANA decreased from 1.04 to almost 1.00 in the last week. This means that sellers are now barely going out. This usually happens when confidence falls. This often signals about fluctuations in the market or early signs of panic, especially when the indicator falls with the price.
This weakness is confirmed by liquidation data. For 7 days, short positions on Solana amounted to $ 1.28 billion, while long positions – $ 924 million. Traiders make large rates for a further decline in SOLANA price. An increase in short positions, coupled with dynamics, indicates the lack of hopes for growth in the near future.
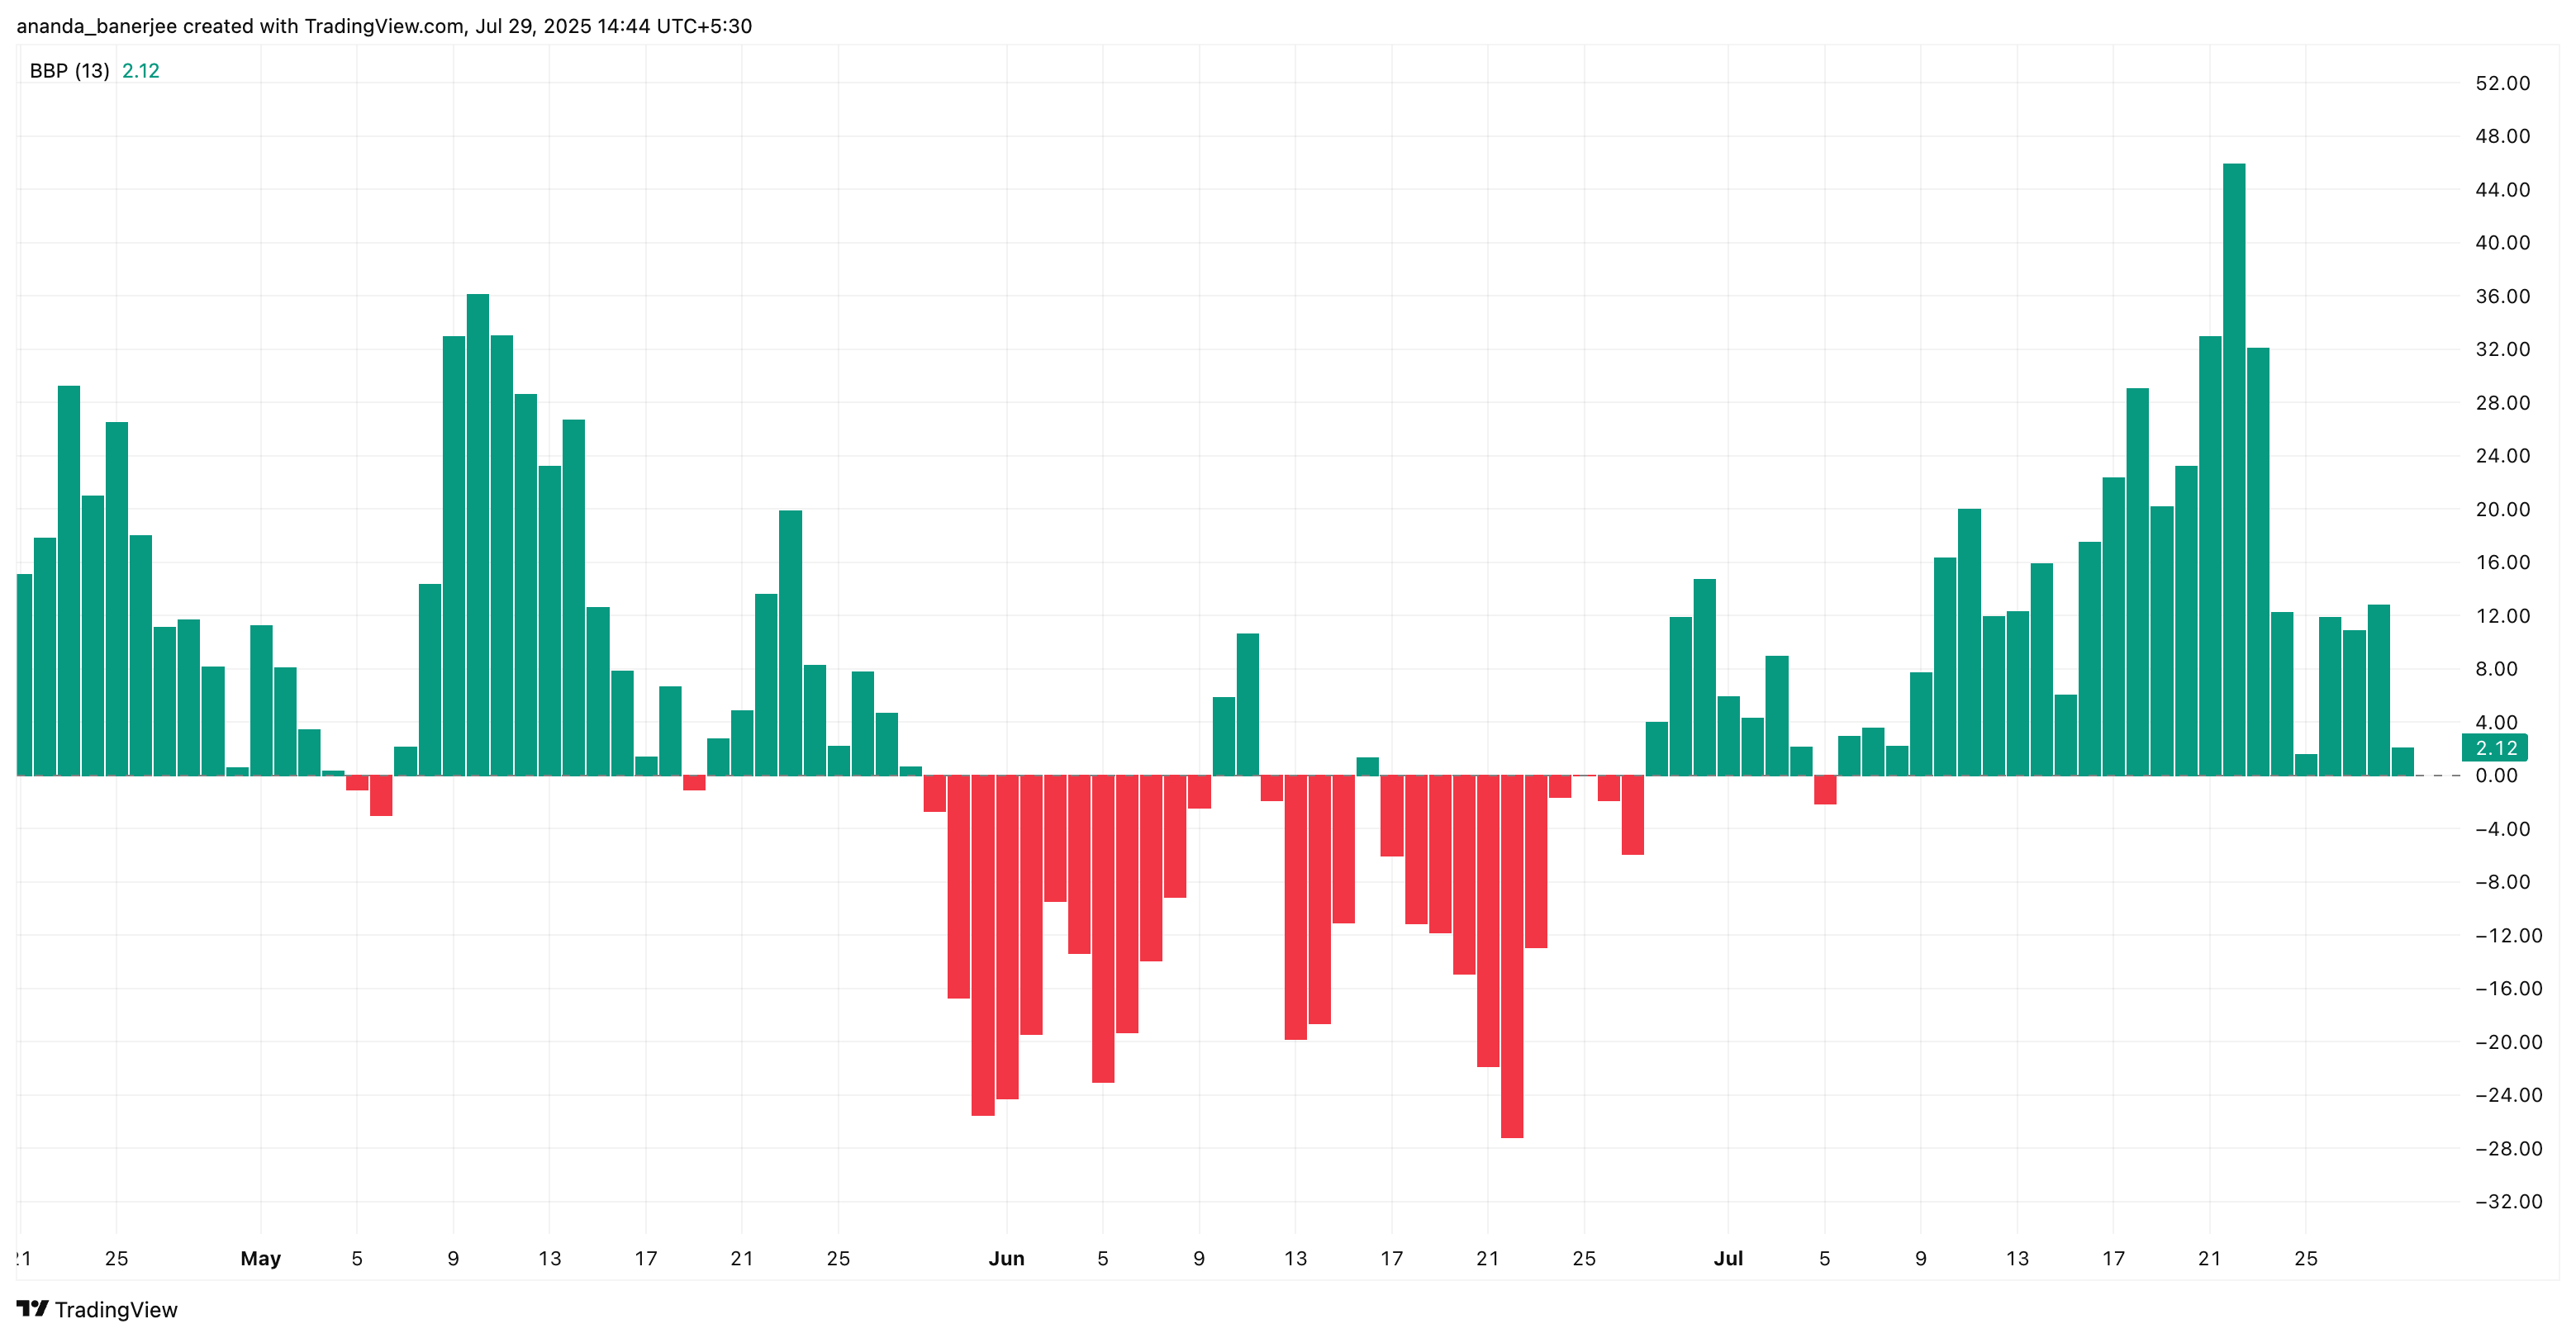
Bull impulse loses strength
The Bull-Bear Power index, which measures the balance of forces between customers and sellers, shows the downward trend. This indicates that buyers are gradually losing control, and the correction is deepening. Reducing the strength of the bulls means that aggressive purchases on downs are less common. This reduces the chances of quick recovery. Cooling does not necessarily violate the long -term SOLANA trend, but indicates a pause of bulls. Without a new wave of interest, the price may remain weak or decrease before significant recovery begins.
See also: Coinbase launches nano-fuses for XRP and Solana
Level $ 175 – Key support for SOLANA
From the point of view of the dynamics, the price rolled away from the local maximum $ 206 and now fluctuates about $ 184. Based on the correction of Fibonacci from the recent minimum of $ 125 to maximum $ 206, the key support level is $ 175. This is a classic correction zone 38.2%. It is often considered as the first serious support in a healthy upward trend.
If SOL holds on this level, it can bargain in the range, and then make a new growth attempt. However, a breakthrough above $ 187, key resistance, can quickly change the short -term bear scenario to the bull.
If the level of $ 175 is punched, this can lead to a deeper correction, confirming the bearish SOPR bearings, the liquidation and weakening of the bulls of the bulls.
Be in the know! Subscribe to Telegram.
Source: Cryptocurrency
I am an experienced journalist and writer with a career in the news industry. My focus is on covering Top News stories for World Stock Market, where I provide comprehensive analysis and commentary on markets around the world. I have expertise in writing both long-form articles and shorter pieces that deliver timely, relevant updates to readers.


