Bitcoin
The cost of bitcoin in recent days, starting on May 11, has practically not changed. The largest cryptocurrency in capitalization is still traded just above $ 104,000. On Monday, May 12, BTC reached a value above $ 105,000, but it has not yet been destined to stay above this mark.
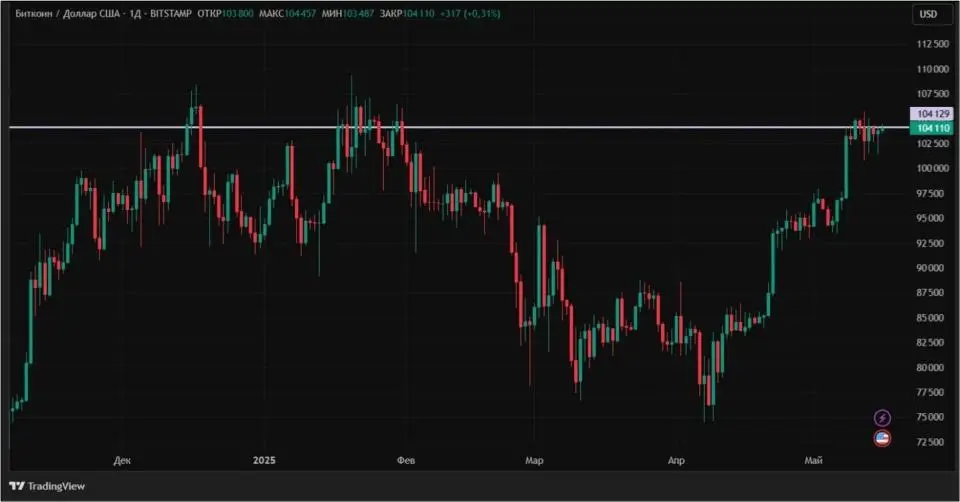
Source: https://ru.tradingView.com
Some of the crypto -investors had hopes for negotiations in Turkey. At some point, there were hopes that American President Donald Trump would look at negotiations. However, the reality was not rainbow. At the head of the Russian representatives was not Vladimir Putin, but his assistant Vladimir Medinsky. As a result, Trump did not come to Turkey. The Ukrainian side ultimately rejected the requirements of the Russian, and Russian did not agree to a 30-day truce. This is clearly not the same
Resultswhich were counted on crypto enthusiasts.
But the analysts of the Cryptoquant platform notice positive shifts in the behavior of large players (whales). The influx of bitcoin from investment companies on the largest Binance exchange since the beginning of April, when the BTC went in growth, has constantly been reduced. It is interesting that at the same time, retail players, on the contrary, increased the number of bitcoins on accounts on this exchange. Cryptoquant notes that the overall influx of BTC is much lower than during the time of previous market peaks. In addition, the analysts of the site
They believethat the behavior of whales has a greater weight compared to retail investors.
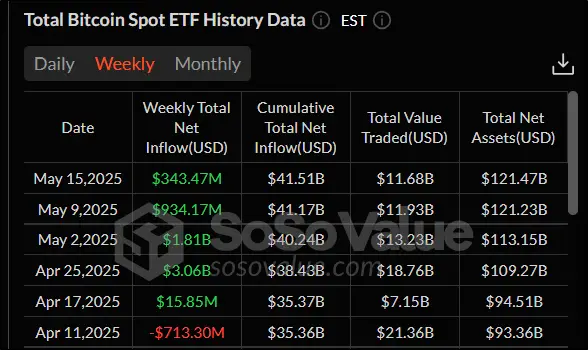
Interest from institutional investors is also confirmed by the dynamics of the SPOT ETF on Bitcoin. For five weeks in a row, an influx of funds has been fixed in exchange funds. Last week (from Monday, May 12, Thursday, May 16, inclusive), it amounted to $ 343.47 million.
Source: sosovalue.com
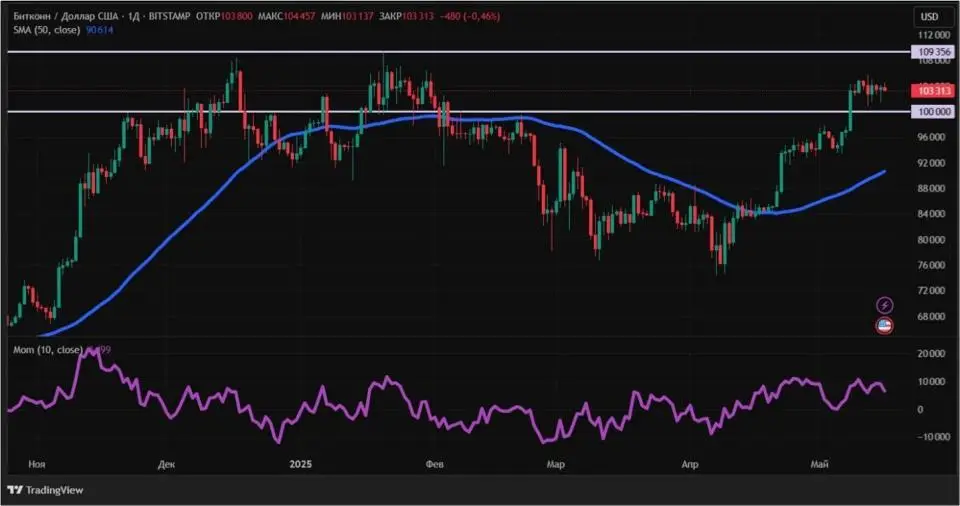
From the point of view of technical analysis, bitcoin remains in the upward trend. This is evidenced by indicators: the price is higher than a 50-day sliding average (indicated in blue), and Momentum remains positive. Support and resistance levels: $ 100,000 and $ 109,356, respectively.
Source: TradingView.com
Index
Fear and greed Compared to May 11, it grew to one point. Its meaning now is 71. This indicates the predominance of greed over fear in the moods of crypto -investors.
Ethereum
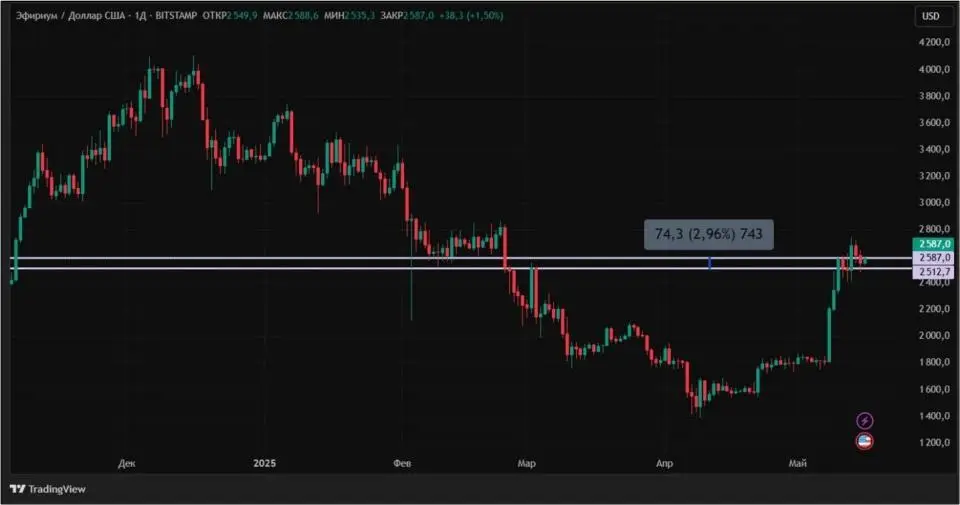
Unlike bitcoin, which showed near -headed dynamics, the ether from May 11 to 16, 2025 increased by 2.96%. Rising on May 11 above $ 2,700 for the first time from February 24, Eth moved to correction. While she is local.
Source: TradingView.com
One of the reasons for the growth of the second in capitalization of cryptocurrency was the rise in an open interest in it to four -month maximums. The indicator again exceeded $ 30 billion. The last time it was so large on February 1, 2025. Such a dynamics of open interest demonstrates an increase in demand for derivatives associated with ETH.

Source: Coinglass.com
But the analysts of the platform
Glassnode So far, they are far from euphoria. Experts recorded a significant increase in the LiveLance indicator, which characterizes the behavior of long -term ETH tokens holders. The dynamics of this metric indicates the desire of investors to fix the profit here and now. Thus, the further growth of the ether is subjected to serious doubts. It is worth noting that LiveLESS
showed Significant growth for the first time in the last three months.
In spotes, ETF on the air of the dynamics over the last four trading sessions turned out to be multidirectional. For two days, an influx of cash was recorded and the same amount of days – an outflow. In total, the influx was larger than the outflow of $ 19.47 million.
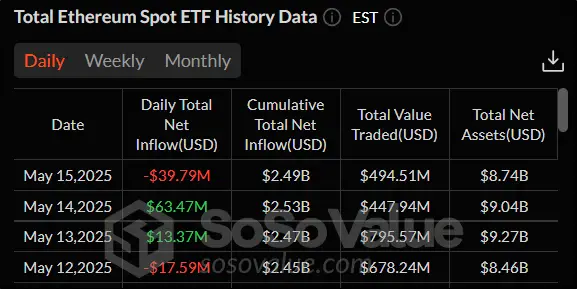
Source: sosovalue.com
From the point of view of technical analysis, the ether remains in the ascending trend. The price of a coin is still much higher than a 50-day sliding average (indicated in blue). But the oscillators entered the overwhelming area, which can serve as a harbinger of correction. However, it is worth noting that the same stochastic is there for almost a month, and during this time the price of the broadcast increased by $ 1000. This suggests that with a bull trend, oscillators can indicate overhabitation for a long time, but price decrease will not occur. Current support and resistance levels: $ 2,404.7 and $ 2,738.9, respectively.
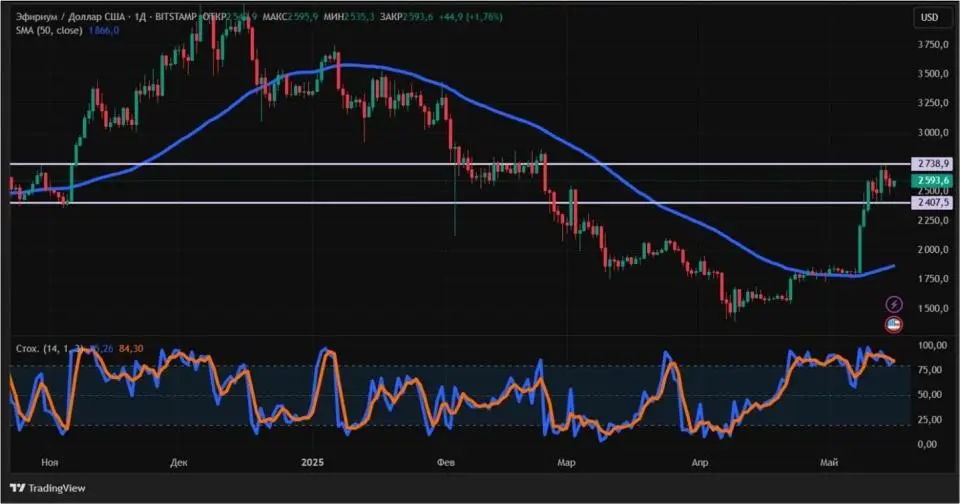
Source: TradingView.com
SUI
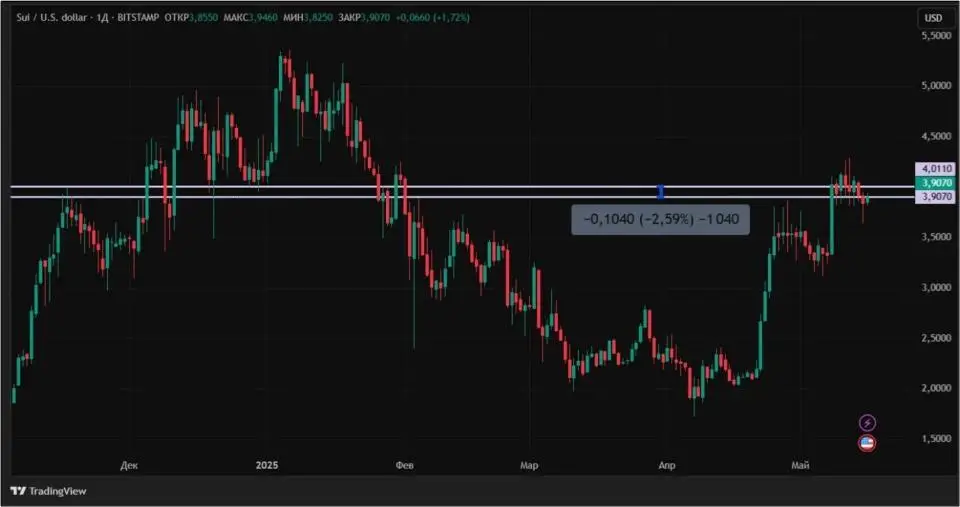
SUI from 11 to 16 May fell 2.59%. The rollback was quite expected, taking into account the fact that from May 6 to 12 this cryptocurrency added more than 38%. Despite a slight decrease, SUI is still traded near its three -month maxima.
Source: TradingView.com
Despite the decrease in the cost of cryptocurrency in recent days, the news background is quite positive. On May 14, SUI updated its historical maximum according to the TVL indicator – the number of assets blocked in the protocols. Now the record value is $ 2.11 billion. The previous maximum ($ 2.084 billion) was recorded on January 5, 2025. It is worth noting that SUI is already taking eighth place in TVL among all networks.
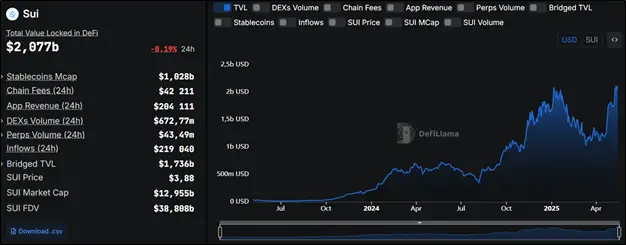
Source: Defillama.com
This week, a collaboration was announced with the Swiss investment company 21SHARES, which is known for its ETP, including explosion ETF (Ceth) and Bitcoin (Arkb). Partnership will allow SUI to become even more recognizable. In addition, this is another step towards recognizing this cryptocurrency by large investment companies. For 21Shares
cooperation With SUI is a step towards expanding the presence in the American market.
And on May 13 it became known about
integration with American crypto -rises Backpack. Users will now be able to sell, occupy and exchange assets on this site. They will also access the functionality of the inter -grid bridge. The cherry on the cake will be the Backpack program aimed at increasing user activity. Its participants will be able to become
owners Awards from a pool of $ 200,000.
From the point of view of technical analysis, the medium -term initiative remains in the bulls (buyers) of cryptocurrency. This is evidenced by the excess of SUI at a 50-day sliding average (indicated on the graph in blue). Nevertheless, the moment to enter the transaction is not the most suitable now. This is due to the fact that the MACD histogram crossed the zero line from top to bottom, signaling the short -term correction, which occurs. The nearest levels of support and resistance to daily graphics: $ 3.64 and $ 4.29, respectively.
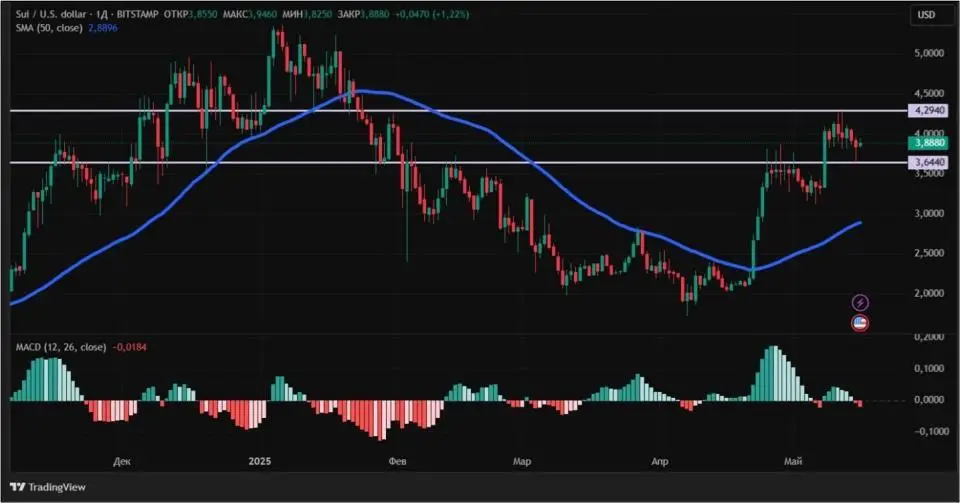
Source: TradingView.com
Conclusion
Thus, the overall picture on the cryptornka remains positive. However, a politician remains an important factor. And there is no clarity with her. As a result, crypto -investors prefer to take a waiting position so far.
This material and information in it is not an individual or other other investment recommendation. The view of the editorial office may not coincide with the opinions of analytical portals and experts.
Source: Bits
I am an experienced journalist, writer, and editor with a passion for finance and business news. I have been working in the journalism field for over 6 years, covering a variety of topics from finance to technology. As an author at World Stock Market, I specialize in finance business-related topics.

