
- The US Dollar Index (DXY) hits fresh cycle highs near 104.20 on Monday.
- The continuation of the bullish stance could reach 105.00.
The US Dollar Index (DXY) extends the move higher and reaches new highs in the area of 104.20 at the beginning of the week.
That said, if the bounce accelerates further, then the index could challenge the round level at 105 ahead of 105.63 (11 Dec 2002 high).
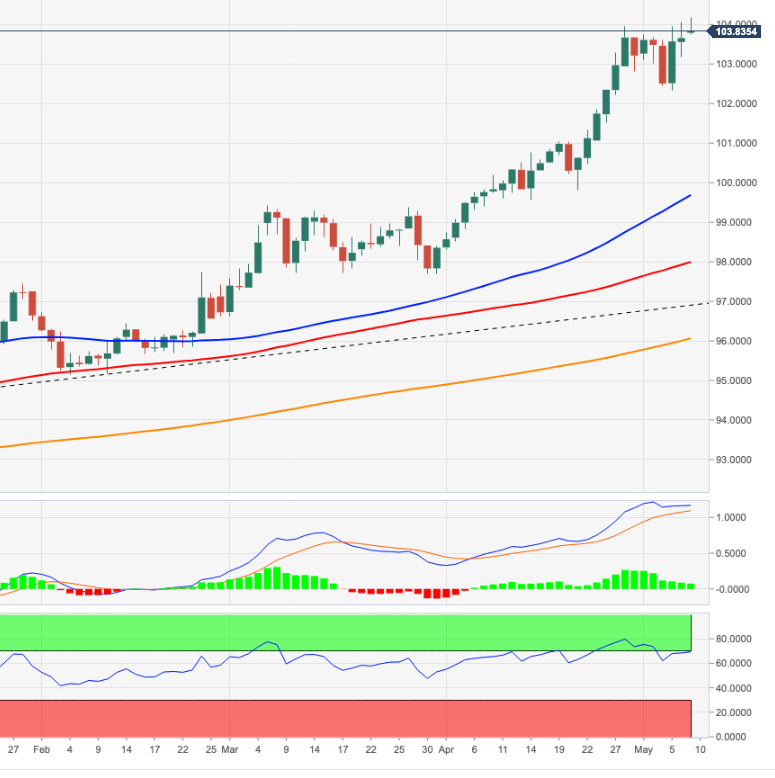
The current bullish stance in the index remains supported by the 8-month line at the 97.00 limits, while the long-term outlook for the dollar is seen as constructive above the 200-day SMA at 96.04.
DXY daily chart
Technical levels
Source: Fx Street
With 6 years of experience, I bring to the table captivating and informative writing in the world news category. My expertise covers a range of industries, including tourism, technology, forex and stocks. From brief social media posts to in-depth articles, I am dedicated to creating compelling content for various platforms.


