
- The US Dollar Index (DXY) is trading on the defensive for the second session in a row.
- Probably further rally past 2023 high near 105.90.
The US dollar index (DXY) adds to Thursday’s daily decline and challenges the 105.00 level ahead of Friday’s US NFP release.
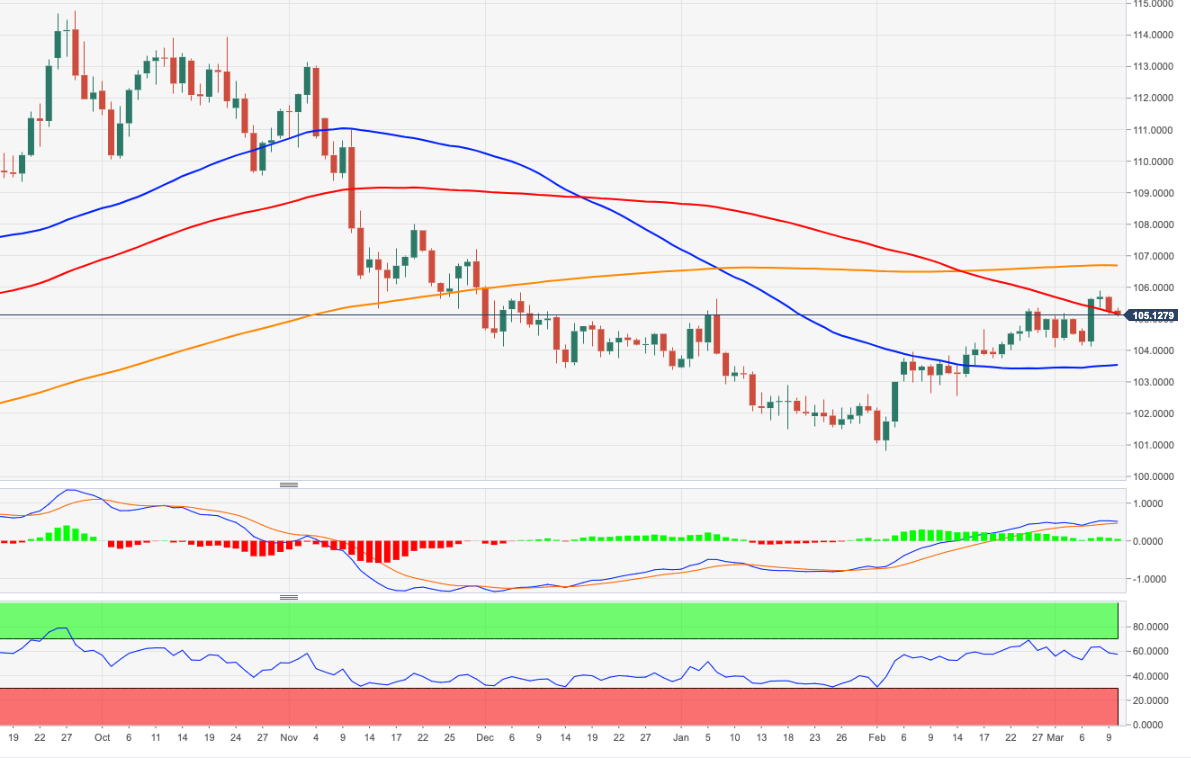
Despite the corrective decline, the positive outlook for the dollar does not seem to change. That being said, breaking the year-over-year high at 105.88 (March 8) should pave the way for a continuation of the uptrend to the key 200-day SMA at 106.62 today.
A convincing move beyond the latter should change the outlook to constructive on the near term horizon.
DXY daily chart
Source: Fx Street
I am Joshua Winder, a senior-level journalist and editor at World Stock Market. I specialize in covering news related to the stock market and economic trends. With more than 8 years of experience in this field, I have become an expert in financial reporting.
")


