
- The DXY attempts a moderate recovery, although it is still trading below 104.00.
- The 55-day SMA around 103.50 keeps the DXY away from a dip.
The US dollar index (DXY) records a decent bounce off Monday’s multi-week lows at 103.50.
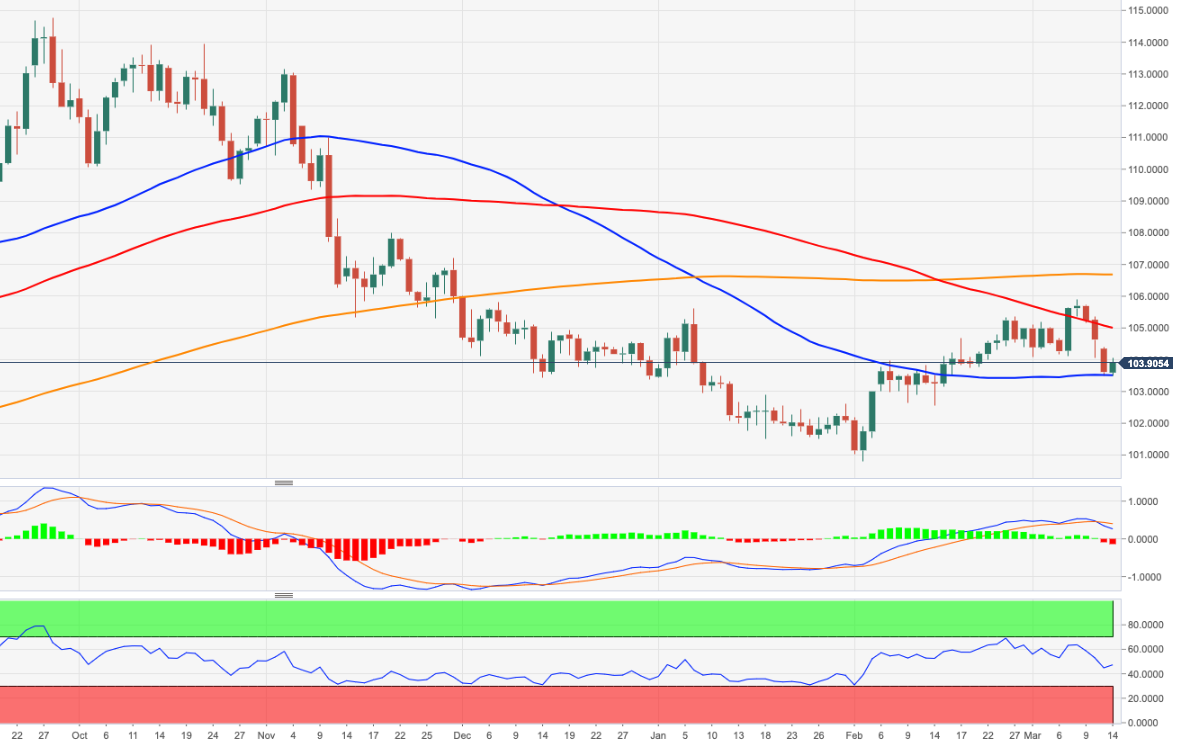
Despite the daily bounce, the index remains under pressure and appears to still be supported by recent lows near 103.50, an area coincident with the interim 55-day SMA. Below the latter, the dollar could fall back to the weekly low of 102.58 (February 14).
Meanwhile, below the 200-day SMA at 106.63, the outlook for the greenback is expected to remain negative.
DXY daily chart
Source: Fx Street
I am Joshua Winder, a senior-level journalist and editor at World Stock Market. I specialize in covering news related to the stock market and economic trends. With more than 8 years of experience in this field, I have become an expert in financial reporting.


