
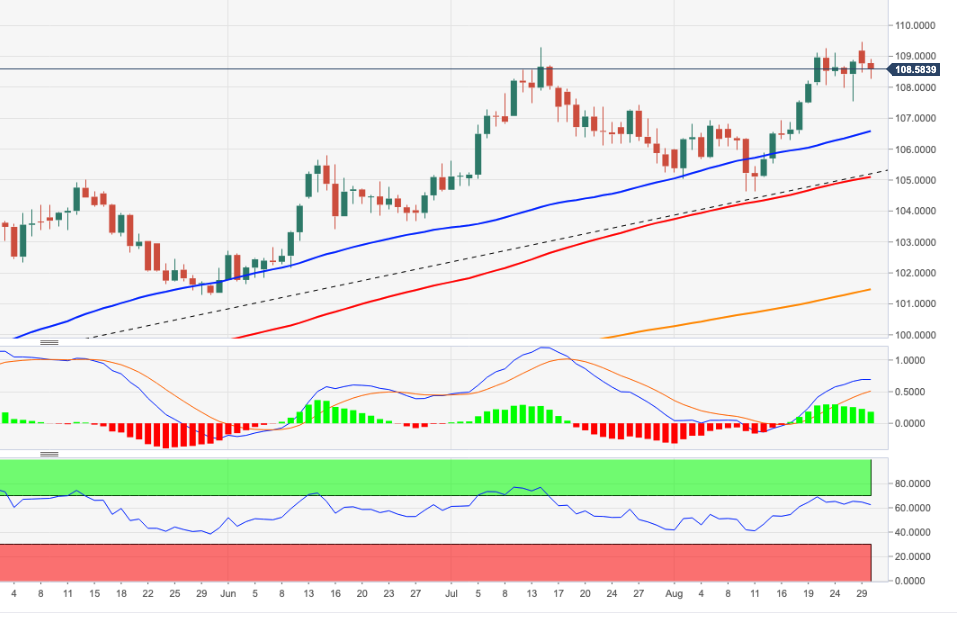
- DXY adds to Monday’s pullback and pulls back to the 108.00 area.
- The decline seems capped by the 107.60 area (Aug 26).
The US Dollar Index (DXY) continues to correct lower after Monday’s rejection of fresh cycle highs around 109.50.
The index appears to have entered a consolidation phase, with the lower bound at recent lows near 107.60 (Aug 26 low). On the other hand, the breakout of the 2022 high at 109.47 (Aug 29) could encourage the dollar to revisit the September 2002 high at 109.77 before the round level at 110.00.
Meanwhile, as long as it is above the 6-month support line around 105.40, DXY is expected to maintain the positive stance in the short term.
As for the long-term scenario, the bullish view on the dollar remains as long as it is above the 200-day SMA at 100.80.
DXY daily chart
Technical levels
Source: Fx Street
With 6 years of experience, I bring to the table captivating and informative writing in the world news category. My expertise covers a range of industries, including tourism, technology, forex and stocks. From brief social media posts to in-depth articles, I am dedicated to creating compelling content for various platforms.


.jpg "Noma Copenhagen: now you can taste their crazy condiments at home")


