
- The DXY index regains bullish traction and advances above 102.00.
- A further pullback could retest the 101.65 level in the short term.
The dollar regains traction and leads the DXY index to rally above the 102.00 level during the European session on Wednesday.
The DXY index remains under pressure and therefore further losses cannot be ruled out at the moment. Conversely, a break of the May low at 101.64 (May 24) could pave the way for a visit to the 55-day SMA today at $100.97 on the short-term horizon.
In the bigger picture, the current bullish stance of the DXY index remains supported by the 3-month line around 100.40. On the longer term outlook, as long as the DXY index is above the 200 day SMA, today at 96.68, the view will be constructive.
DXY index daily chart
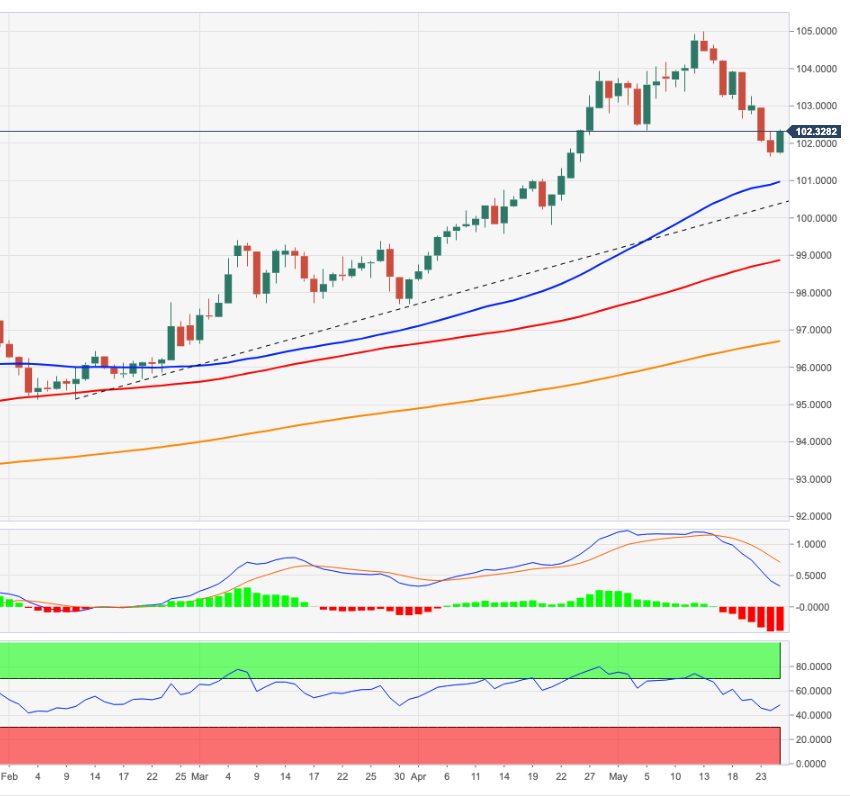
DXY Index Technical Levels
Source: Fx Street
With 6 years of experience, I bring to the table captivating and informative writing in the world news category. My expertise covers a range of industries, including tourism, technology, forex and stocks. From brief social media posts to in-depth articles, I am dedicated to creating compelling content for various platforms.


