
- The index is under pressure and revisits the 101.60 zone.
- A steeper decline should target the May 2022 low near 101.30.
The US Dollar Index (DXY) starts the week offered and bounces from the lows initially touched in the 101.60/55 zone on Monday.
The index appears to be gradually losing ground amid a broader bearish outlook for the dollar. Should the bears push harder, a loss of the 2023 so-to-date low at 101.52 (Jan 18) could trigger a possible deeper decline to the May 2022 low around 101.30 (May 30). ) before the psychological level of 100.00.
Meanwhile, below the 200-day SMA at 106.45, the outlook for the index should remain negative.
DXY daily chart
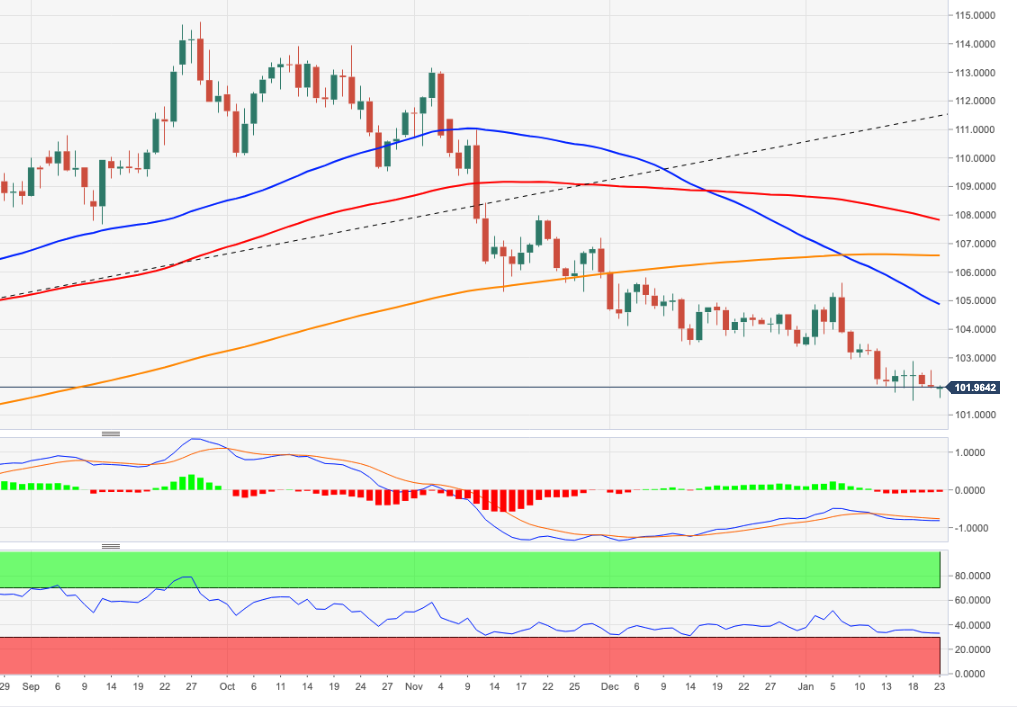
Source: Fx Street
I am Joshua Winder, a senior-level journalist and editor at World Stock Market. I specialize in covering news related to the stock market and economic trends. With more than 8 years of experience in this field, I have become an expert in financial reporting.


