
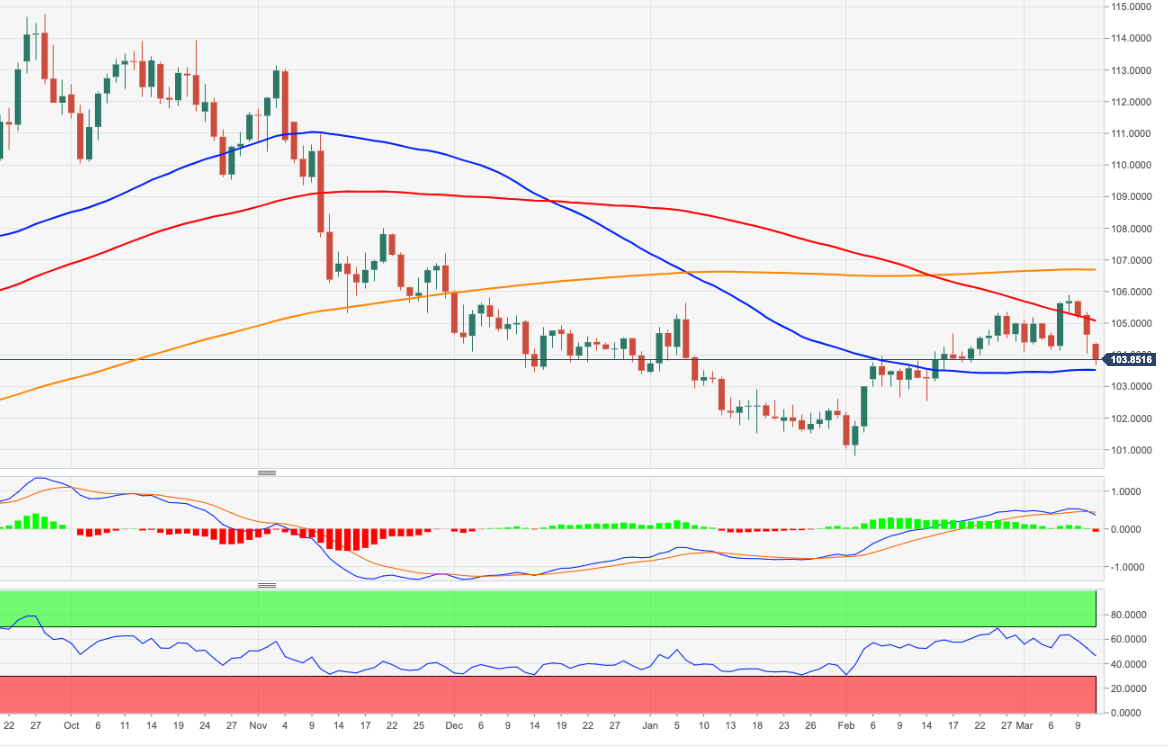
- The DXY intensifies the decline and breaks 104.00 on Monday.
- The 55-day SMA near 103.50 should offer some initial support.
The US dollar index (DXY) extends strong bearish momentum and breaks below the 104.00 support to record fresh multi-week lows.
Should sellers push harder, then the index should face temporary support at the 55-day SMA at 103.51 ahead of the weekly low at 102.58 (Feb 14).
Meanwhile, below the 200-day SMA at 106.62, the outlook for the greenback will remain negative.
DXY daily chart
Source: Fx Street
I am Joshua Winder, a senior-level journalist and editor at World Stock Market. I specialize in covering news related to the stock market and economic trends. With more than 8 years of experience in this field, I have become an expert in financial reporting.


