
- The US Dollar Index (DXY) remains on the back foot and tests the 103.00 zone.
- Further losses could see it revisit the weekly low of 102.58.
The US dollar index (DXY) adds to the ongoing decline and tests the 103.00 zone on Tuesday.
At the moment, the bears seem not to budge. Against this, there is minor support at the weekly low of 102.58 (Feb 14), while the loss of this region could trigger a deeper pullback to the 2023 low near 101.80 (Feb 2).
On a bigger picture, as long as it holds below the 200-day SMA, today at 106.62, the outlook for the index is expected to remain negative.
DXY daily chart
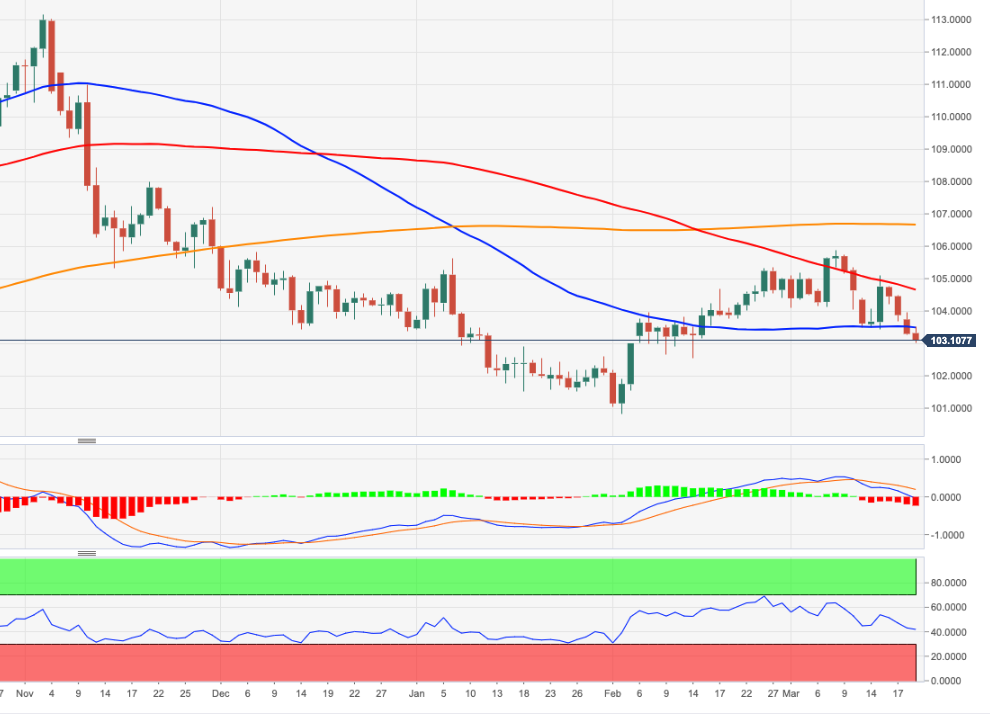
Source: Fx Street
I am Joshua Winder, a senior-level journalist and editor at World Stock Market. I specialize in covering news related to the stock market and economic trends. With more than 8 years of experience in this field, I have become an expert in financial reporting.


 music")


