
- The DXY is experiencing some selling pressure after hitting new year highs.
- Further rises continue to target the 200-day SMA.
The US dollar index (DXY) Cut some of the recent gains near 106.00, or new 2023 highs.
A continuation of the dollar rebound seems likely for now. A break of the round 106.00 level should put the index on track for a probable test of the key 200-day SMA at 106.60 today.
A convincing move beyond the latter should change the outlook to constructive on the near term horizon and allow the uptrend to continue.
DXY daily chart
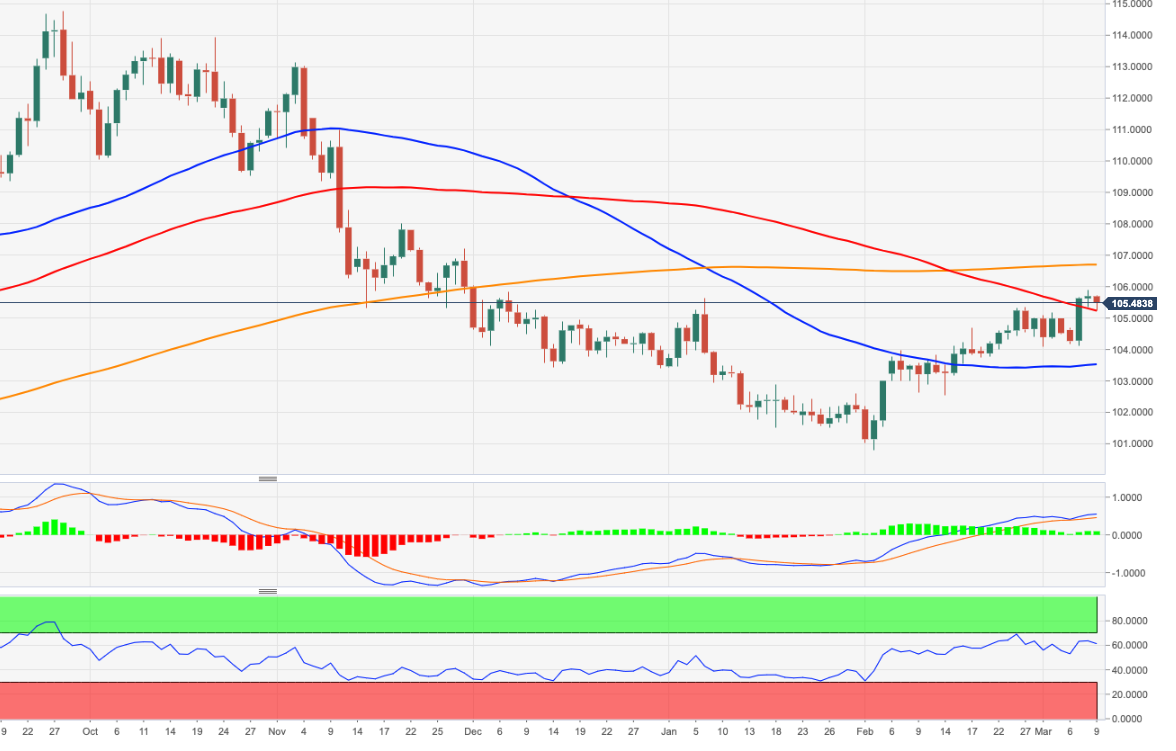
Source: Fx Street
I am Joshua Winder, a senior-level journalist and editor at World Stock Market. I specialize in covering news related to the stock market and economic trends. With more than 8 years of experience in this field, I have become an expert in financial reporting.


