
- The US Dollar Index (DXY) adds to Friday’s pullback and revisits the 107.20 area.
- Should declines accelerate, the index could retest the 105.80 zone.
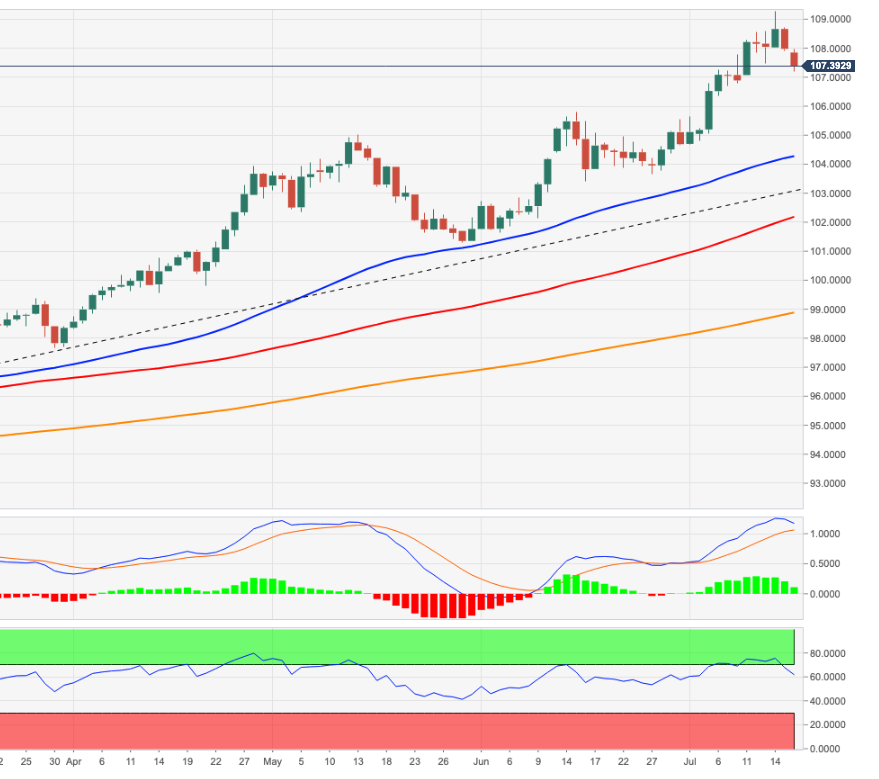
The US Dollar Index (DXY) continues to fall and marks new multi-day lows in the 107.20 area on Monday.
The index comes out of the overbought zone and opens the door to a further decline in the very short term. That said, the deterioration in the short-term outlook could see the index revisit post-FOMC highs near 105.80 (June 15).
As long as the index trades above the 5-month line near 103.30, the short-term outlook for DXY should remain constructive.
Also, the broader bullish view holds as long as it is above the 200-day SMA at 98.87.
DXY daily chart
Technical levels
Source: Fx Street
With 6 years of experience, I bring to the table captivating and informative writing in the world news category. My expertise covers a range of industries, including tourism, technology, forex and stocks. From brief social media posts to in-depth articles, I am dedicated to creating compelling content for various platforms.


