
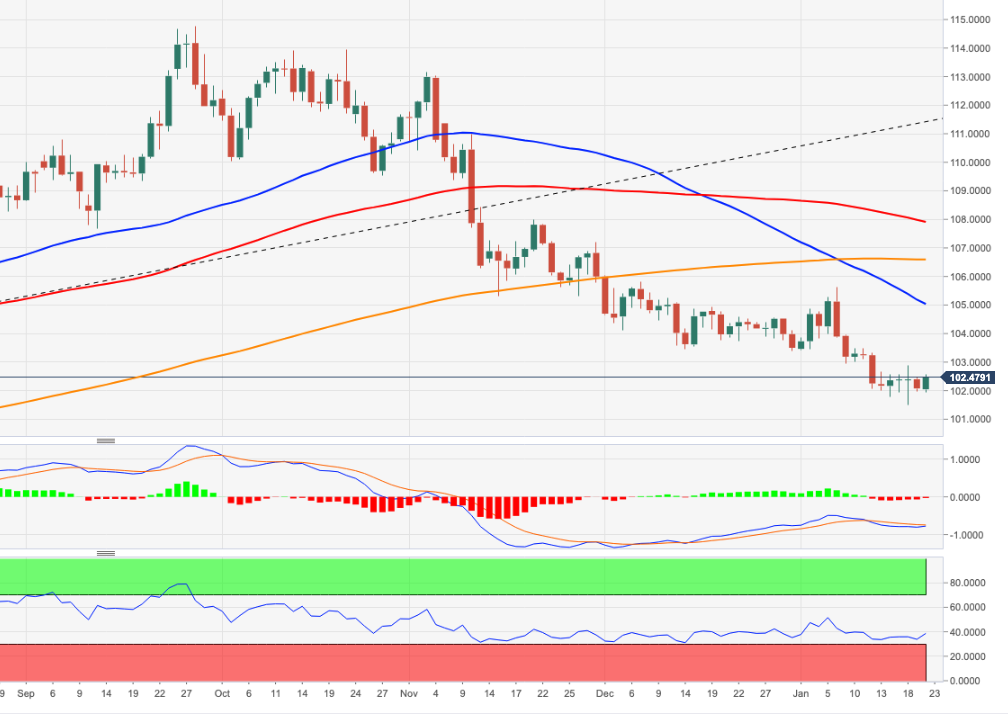
- The index keeps intact the range-bound trend above 102.00.
- The dollar appears to be supported by the multi-year low near 101.80.
The US Dollar Index (DXY) advances to 2-day highs and retests the 102.50 area by the end of the week.
For now, the continuation of the sideways trend seems the most likely scenario for the dollar in the short term. Should the bears regain control, the loss of the January low at 101.77 (Jan 16) should put a possible deeper fall back to the May 2022 low around 101.30 ( May 30) before the psychological level of 100.00.
Meanwhile, below the 200-day SMA at 106.44, the outlook for the DXY they should remain negative.
DXY daily chart
Source: Fx Street
I am Joshua Winder, a senior-level journalist and editor at World Stock Market. I specialize in covering news related to the stock market and economic trends. With more than 8 years of experience in this field, I have become an expert in financial reporting.


