
- The US Dollar Index (DXY) reverses the previous bull run to the 106.50/55 area.
- Selling bias resumption could extend to 105.00.
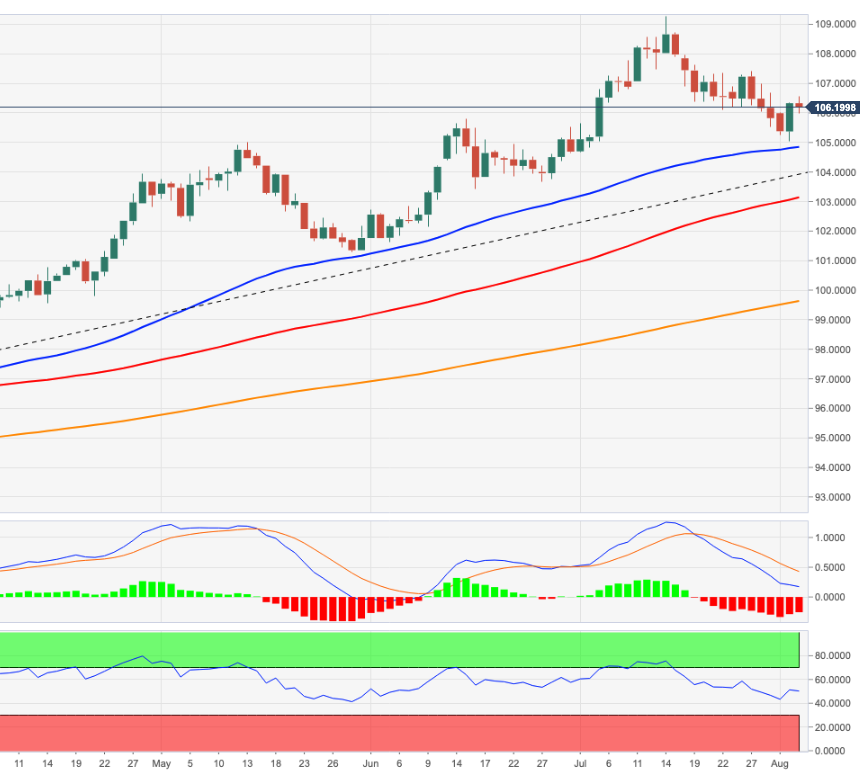
The US Dollar Index (DXY) it leaves Tuesday’s strong advance behind and triggers a downward correction shortly after reaching fresh three-day highs at 106.50 on Tuesday.
Tuesday’s bounce failed to break any major upside barriers and therefore leaves the index vulnerable to further weakness, at least in the short term. In this sense, the dollar faces the tangible possibility of returning to multi-week lows in the area of 105.00 (Aug 2) in the short term. This initial containment zone remains underpinned by the proximity of the 55-day SMA today at 104.84.
Also, the broader bullish view on the dollar remains in place as long as it is above the 200-day SMA at 99.62.
DXY daily chart
Technical levels
Source: Fx Street
With 6 years of experience, I bring to the table captivating and informative writing in the world news category. My expertise covers a range of industries, including tourism, technology, forex and stocks. From brief social media posts to in-depth articles, I am dedicated to creating compelling content for various platforms.


