
- The index remains bobbing below 104.00.
- A move beyond the monthly high at 104.11 exposes further gains.
The US Dollar Index (DXY) sees its recent rise to fresh monthly highs above 104.00 on Thursday pared somewhat.
The ongoing price action leaves the door open for a continuation of the consolidative note for the time being. However, occasional bouts of strength should put the February high at 104.11 (Feb 15) as an immediate hurdle, while breaching this level could open the door for a possible challenge of the 2023 high at 105.63 (Jan 6). ) in the relatively short term.
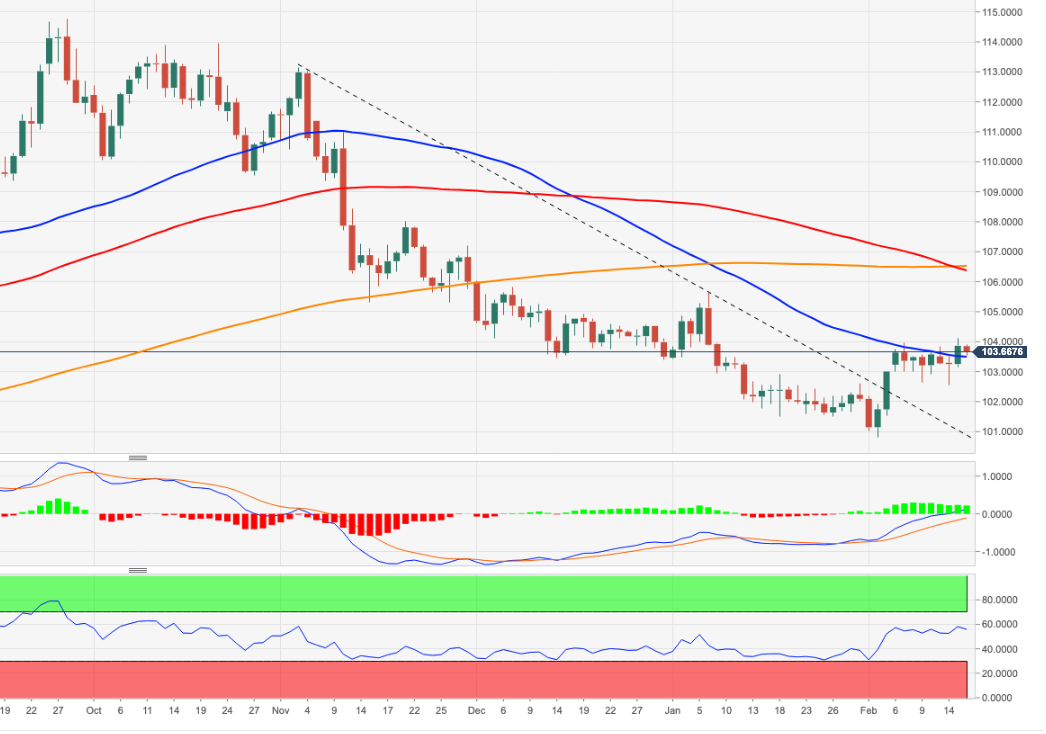
Longer-term, as long as it holds below the 200-day SMA at 106.44, the outlook for the index remains negative.
DXY daily chart
Source: Fx Street
I am Joshua Winder, a senior-level journalist and editor at World Stock Market. I specialize in covering news related to the stock market and economic trends. With more than 8 years of experience in this field, I have become an expert in financial reporting.


