
- The DXY gives some signs of life and recovers 107.00 and more.
- Immediately to the downside is the 200-day SMA at 105.00.
The US dollar index (DXY) reverses two daily falls in a row and manages to recover the area above 107.00 on Thursday.
Despite the rebound, the index remains under watch. That being said, a break of the November low at 105.34 (Nov 15) should lead the DXY to extend losses to the critical 200-day SMA at 105.00 today. The loss of this important region could put a possible drop to the August low of 104.63 (10 Aug) back on the radar.
Below the 200-day SMA, the outlook for the dollar should turn negative.
DXY daily chart
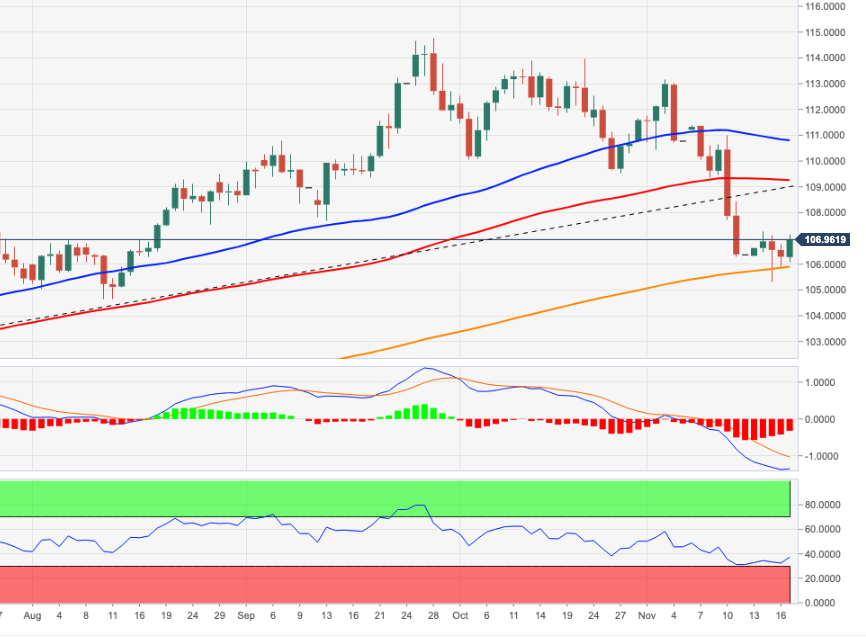
Source: Fx Street
I am Joshua Winder, a senior-level journalist and editor at World Stock Market. I specialize in covering news related to the stock market and economic trends. With more than 8 years of experience in this field, I have become an expert in financial reporting.


