
- DXY manages to regain its composure after Tuesday’s sell-off.
- Losses are expected to accelerate below the monthly low of 103.98.
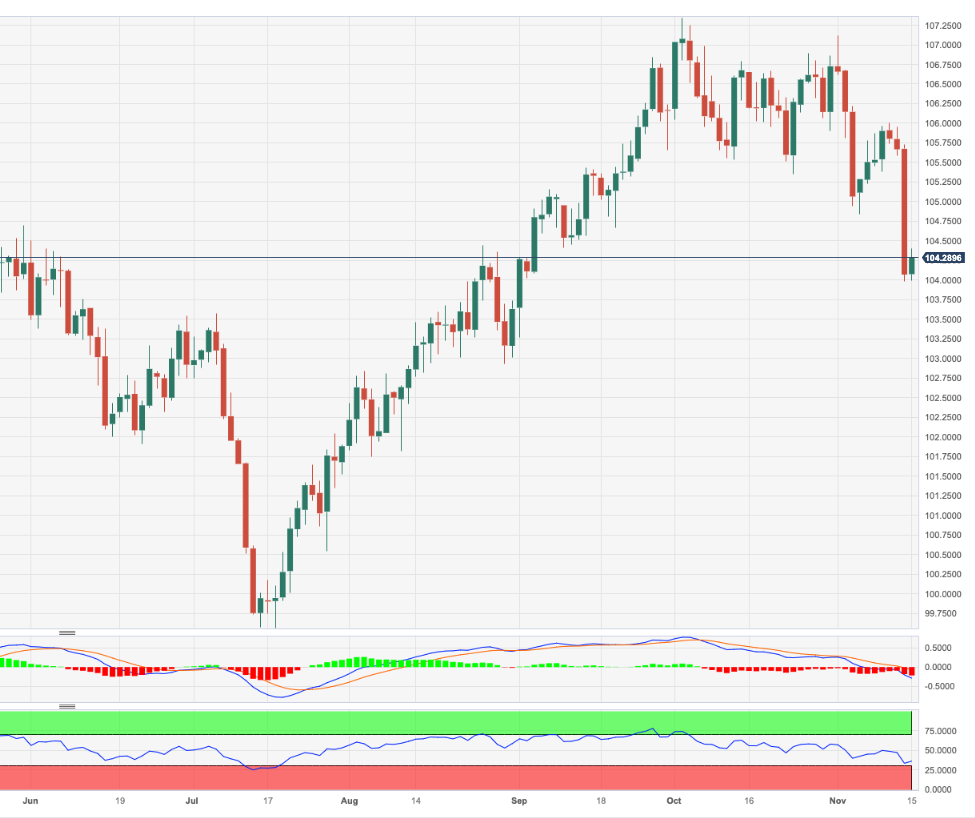
He US Dollar Index (DXY) attempts a slight recovery towards the 104.30/40 area after bottoming just below the 104.00 support early in the session on Wednesday.
The break of the November low of 103.98 (Nov 14-15) should pave the way for a quick test of the critical 200-day SMA at 103.60 before the weekly low of 102.96 (Aug 30).
Meanwhile, as long as it holds above the key 200-day SMA, today at 103.60, the outlook for the DXY is expected to remain constructive.
DXY Daily Chart
Source: Fx Street
I am Joshua Winder, a senior-level journalist and editor at World Stock Market. I specialize in covering news related to the stock market and economic trends. With more than 8 years of experience in this field, I have become an expert in financial reporting.


