
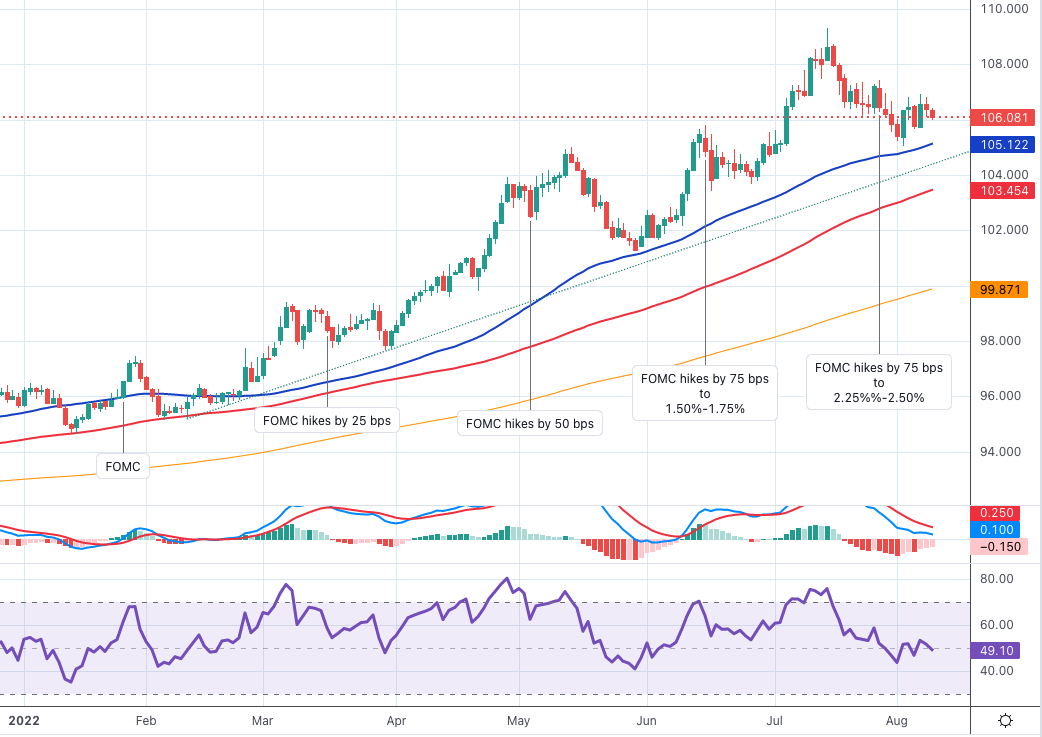
- DXY adds to recent weakness and challenges 106.00.
- A further move towards the 105.00 area is still well underway.
The US Dollar Index (DXY) extends the weekly correction lower and briefly breaks the 106.00 zone on Tuesday.
Continued selling pressure should expose a deeper pullback to initially the August low near 105.00 (Aug 2). This initial containment zone appears to be reinforced by the 55-day SMA.
The constructive short-term stance is expected to remain supported by the 6-month support line today near 104.40.
Also, the broader bullish view on the dollar remains in place as long as it is above the 200-day SMA at 99.87.
DXY daily chart
Technical levels
Source: Fx Street
With 6 years of experience, I bring to the table captivating and informative writing in the world news category. My expertise covers a range of industries, including tourism, technology, forex and stocks. From brief social media posts to in-depth articles, I am dedicated to creating compelling content for various platforms.


