
- US Dollar Index (DXY) at new highs just above 108.00.
- There is now room to hit 2022 highs beyond 109.00.
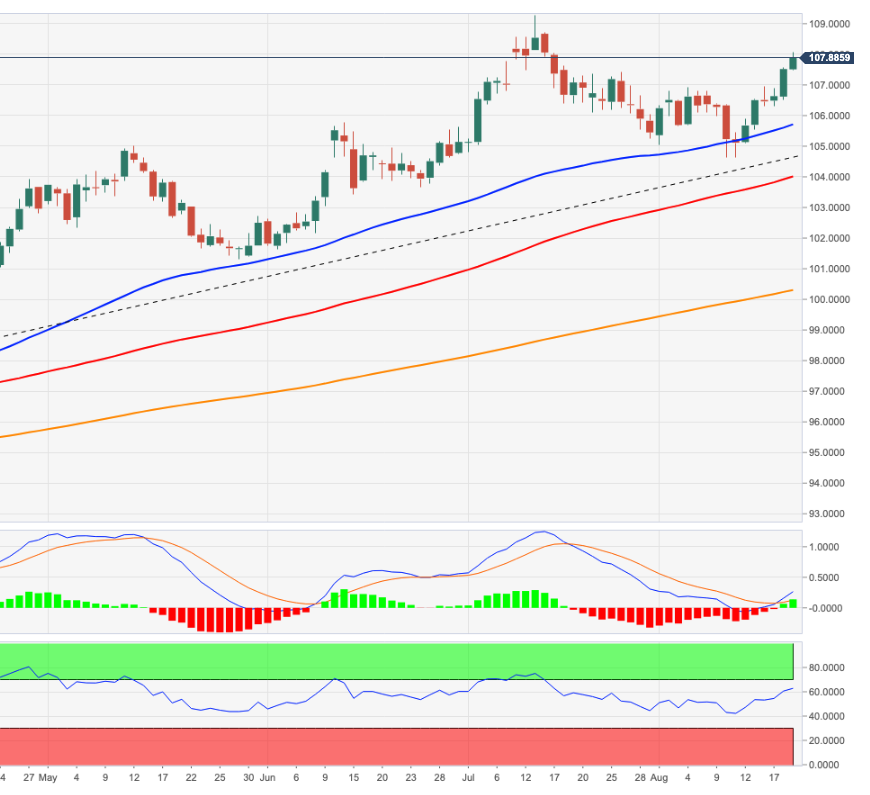
The US Dollar Index (DXY) rises for the third session in a row and trades at fresh multi-week highs just above 108.00 on Friday.
Continuation of the bullish momentum is now expected to target the yearly high at 109.29 (July 14) ahead of the September 2002 high at 109.77. From here comes the round level of 110.00.
Meanwhile, the 6-month support line continues to hold the uptrend around 104.90. Above this zone, the index is expected to maintain the positive stance in the short term.
Looking at the long-term scenario, the bullish view on the dollar holds as long as it is above the 200-day SMA at 100.35.
DXY daily chart
Technical levels
Source: Fx Street
With 6 years of experience, I bring to the table captivating and informative writing in the world news category. My expertise covers a range of industries, including tourism, technology, forex and stocks. From brief social media posts to in-depth articles, I am dedicated to creating compelling content for various platforms.


