
- The Dollar Index advances for two days, forming a “morning star” candlestick chart pattern.
- Oscillators present a mixed picture, although the RSI could be turning bullish.
- A daily close above 103.26 will pave the way for the DXY to test 104.00.
The Dollar Index (DXY), which tracks a basket of six currencies against the US dollar (USD), is up 1.58% after hitting a 7-week low of 101.91. As of this writing, the DXY is trading at 103.12, after reaching a daily low of 102.50.
Dollar Index Price Evolution
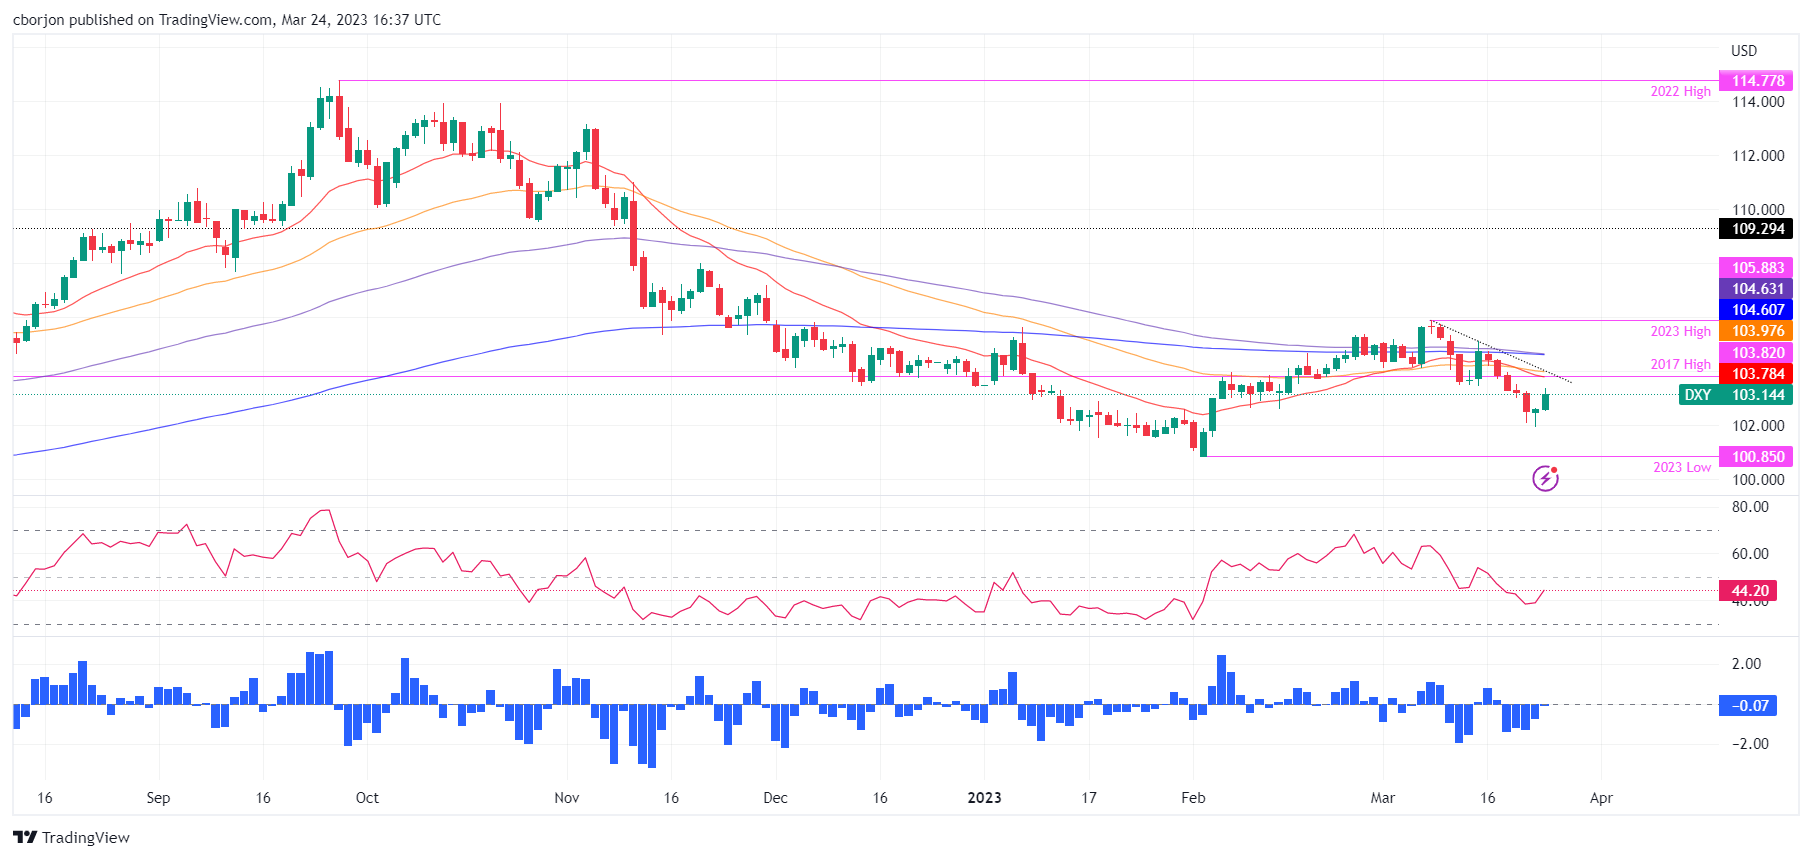
From a daily chart perspective, the DXY is biased neutral as it remains above the 2023 low of 100.85. In addition, the Dollar Index pierced the latest High High (HH) of 105.63 and printed a year-on-year high of 105.88. In addition, a “morning star” candlestick chart pattern is forming which could pave the way for a test of the daily EMAs at around 103.782.
For a bullish resumption, the DXY must make a daily close above the March 22 high of 103.26. With that done, the DXY could test the confluence of the 20-day EMA and the 2017 high at 103.78. If that strong resistance zone is broken, the 50 day EMA at 103.97 is in play, ahead of 104.00.
If not, buying weakness could mean that the ongoing rally is a correction of a continued downtrend. That said, the first support of the Dollar Index would be at 103.00 points. A break of the latter level would expose the March 23 swing low at 101.91, followed by the year-over-year low at 100.85.
Oscillators such as the Relative Strength Index (RSI) follow the trend, although it remains bearish. Conversely, the Rate of Change (RoC) shows that momentum from sellers is waning, on the verge of turning neutral.
US Dollar Index Daily Chart
US Dollar Index Technical Levels
Source: Fx Street
I am Joshua Winder, a senior-level journalist and editor at World Stock Market. I specialize in covering news related to the stock market and economic trends. With more than 8 years of experience in this field, I have become an expert in financial reporting.


