
- The DXY is rallying strongly and breaches the 105.00 barrier.
- The next upside target is the 2023 high near 105.30.
The US dollar index (DXY) resumes weekly rally and recaptures 105.00 and higher, quickly leaving Wednesday’s sharp pullback behind.
Immediately on the upside for the dollar is the February high at 105.35 (February 27). Breaking above this level should pave the way for a continuation of the multi-week uptrend to challenge the 2023 high at 105.63 (Jan 6).
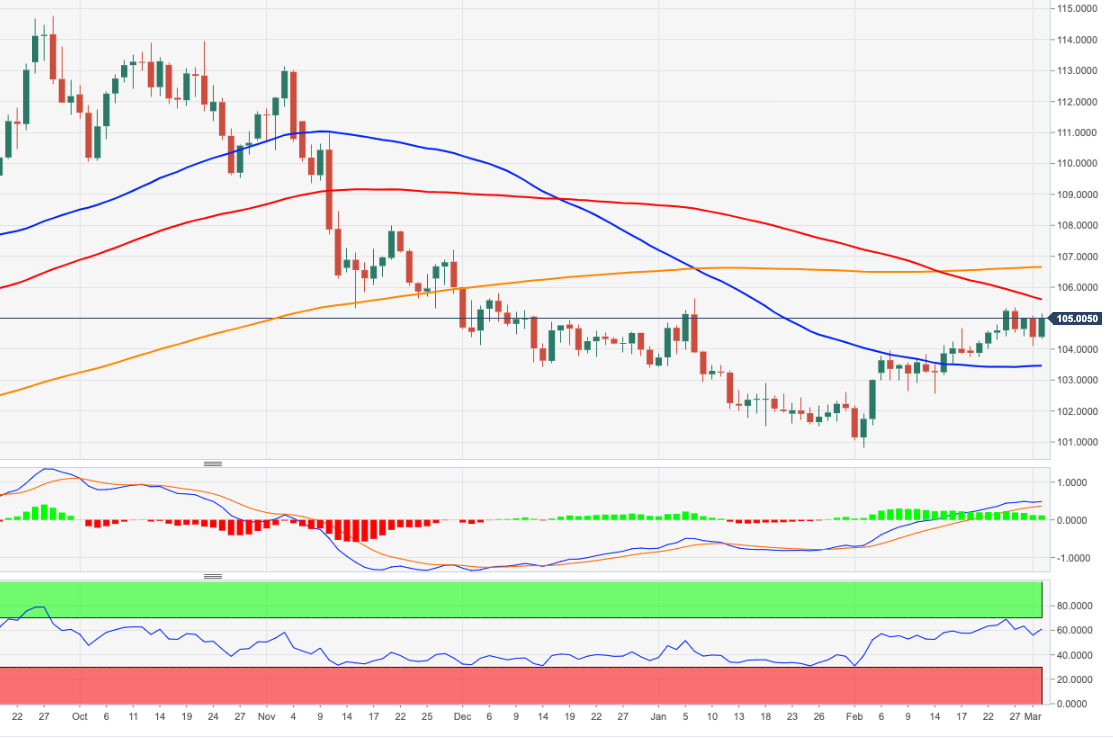
Longer-term, as long as it remains below the 200-day SMA at 106.52, the outlook for the index remains negative.
DXY daily chart
Source: Fx Street
I am Joshua Winder, a senior-level journalist and editor at World Stock Market. I specialize in covering news related to the stock market and economic trends. With more than 8 years of experience in this field, I have become an expert in financial reporting.


